Customer-Centric Product Development: A Decision Framework for Senior PMs
1. Customer-Centric Product Development: What It Actually Means (And What Most Teams Get Wrong)
Most product teams that describe themselves as customer-centric are not.
They run user interviews. They have a #voice-of-customer Slack channel. They ship “feedback-driven” features every quarter. And they still build products that don’t move a single business metric.
The problem is rarely a lack of customer activity. In fact, it’s that customer activity is decoupled from product decisions. Insights are collected, summarized, presented at quarterly all-hands – and then the roadmap moves forward on the same internal assumptions it had before anyone talked to anyone.
A working definition
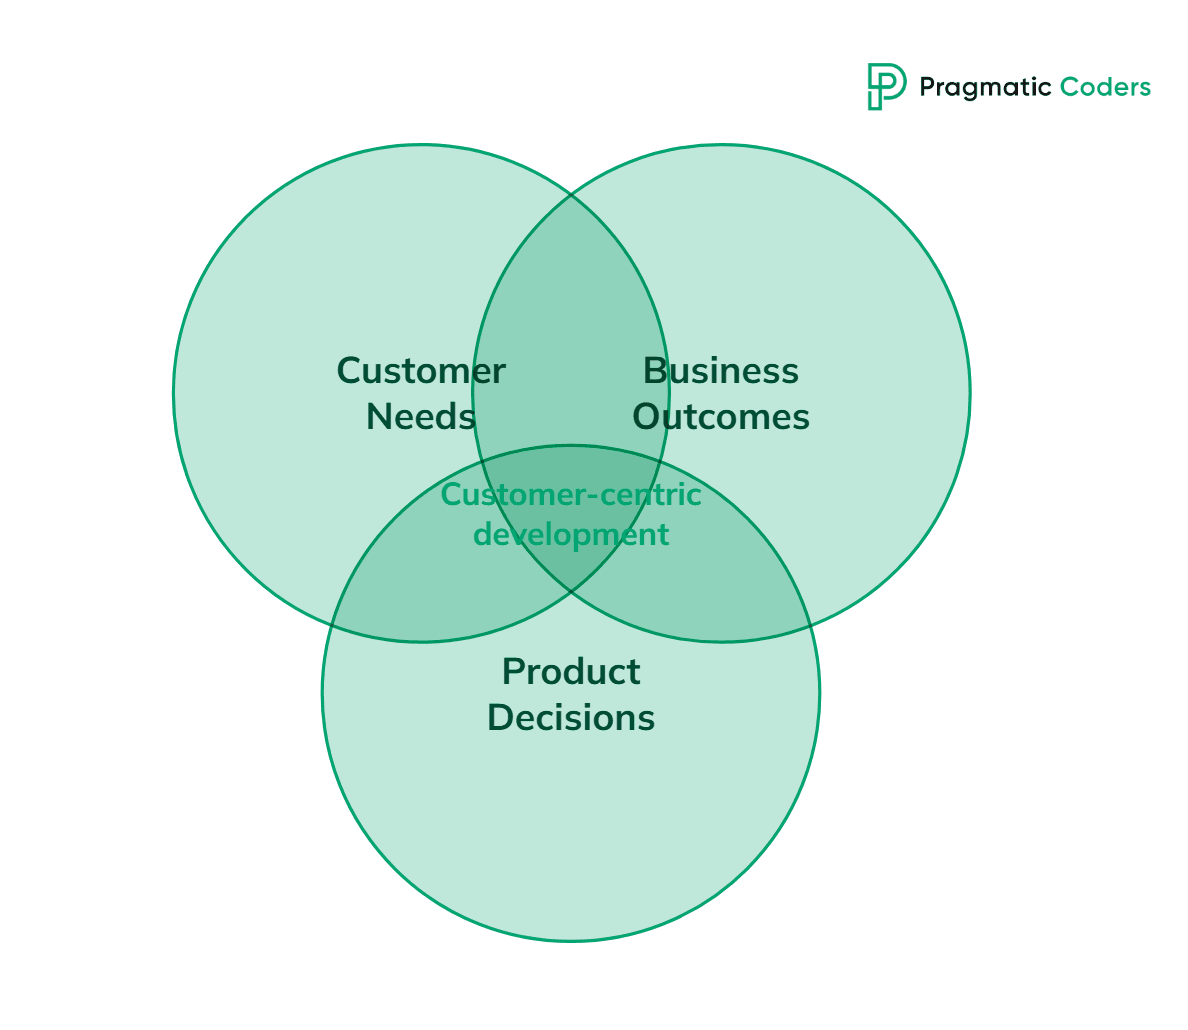
Customer-centric product development is a practice in which every meaningful product decision – from problem definition through feature prioritization through release and iteration – is grounded in evidence about real customer behavior and validated against real customer outcomes, rather than internal assumptions, vocal stakeholder opinions, or executive intuition.
Two phrases in that definition do most of the work.
“Real customer behavior.” Not stated preferences. Not survey aggregates. Not personas built from imagination. What customers actually do, currently pay for, currently work around, currently fail at.
“Real customer outcomes.” Not feature adoption. Not screens shipped. Not story points completed. Whether the customer’s job got easier, faster, cheaper, or more pleasant – and whether that improvement translated into business value the company can sustain.
Why this article exists
There is no shortage of articles defining customer-centricity. Most repeat the same five steps: understand customers, build personas, talk to them, gather feedback, iterate. Useful, but not enough to win in a crowded market – and not enough to give a senior PM something they can run on Monday morning.
This article does three things differently.
- Synthesizes three influential books on customer-centric product work into a single decision framework: Continuous Discovery Habits (Teresa Torres), The Mom Test (Rob Fitzpatrick), and The Lean Product Playbook (Dan Olsen).
- Covers the anti-patterns, not just the practices. Most failure in customer-centric work happens in predictable ways. Naming them is half the fix.
- Connects each idea to a concrete tool you can use this week – interview rules, mapping canvases, prioritization tests – and links them back to assessments your team can run together.
If you came here for a definition, you have it above. If you came here to actually change how your team makes product decisions, keep reading.
2. Why Customer-Centric Product Development Matters More Than Ever
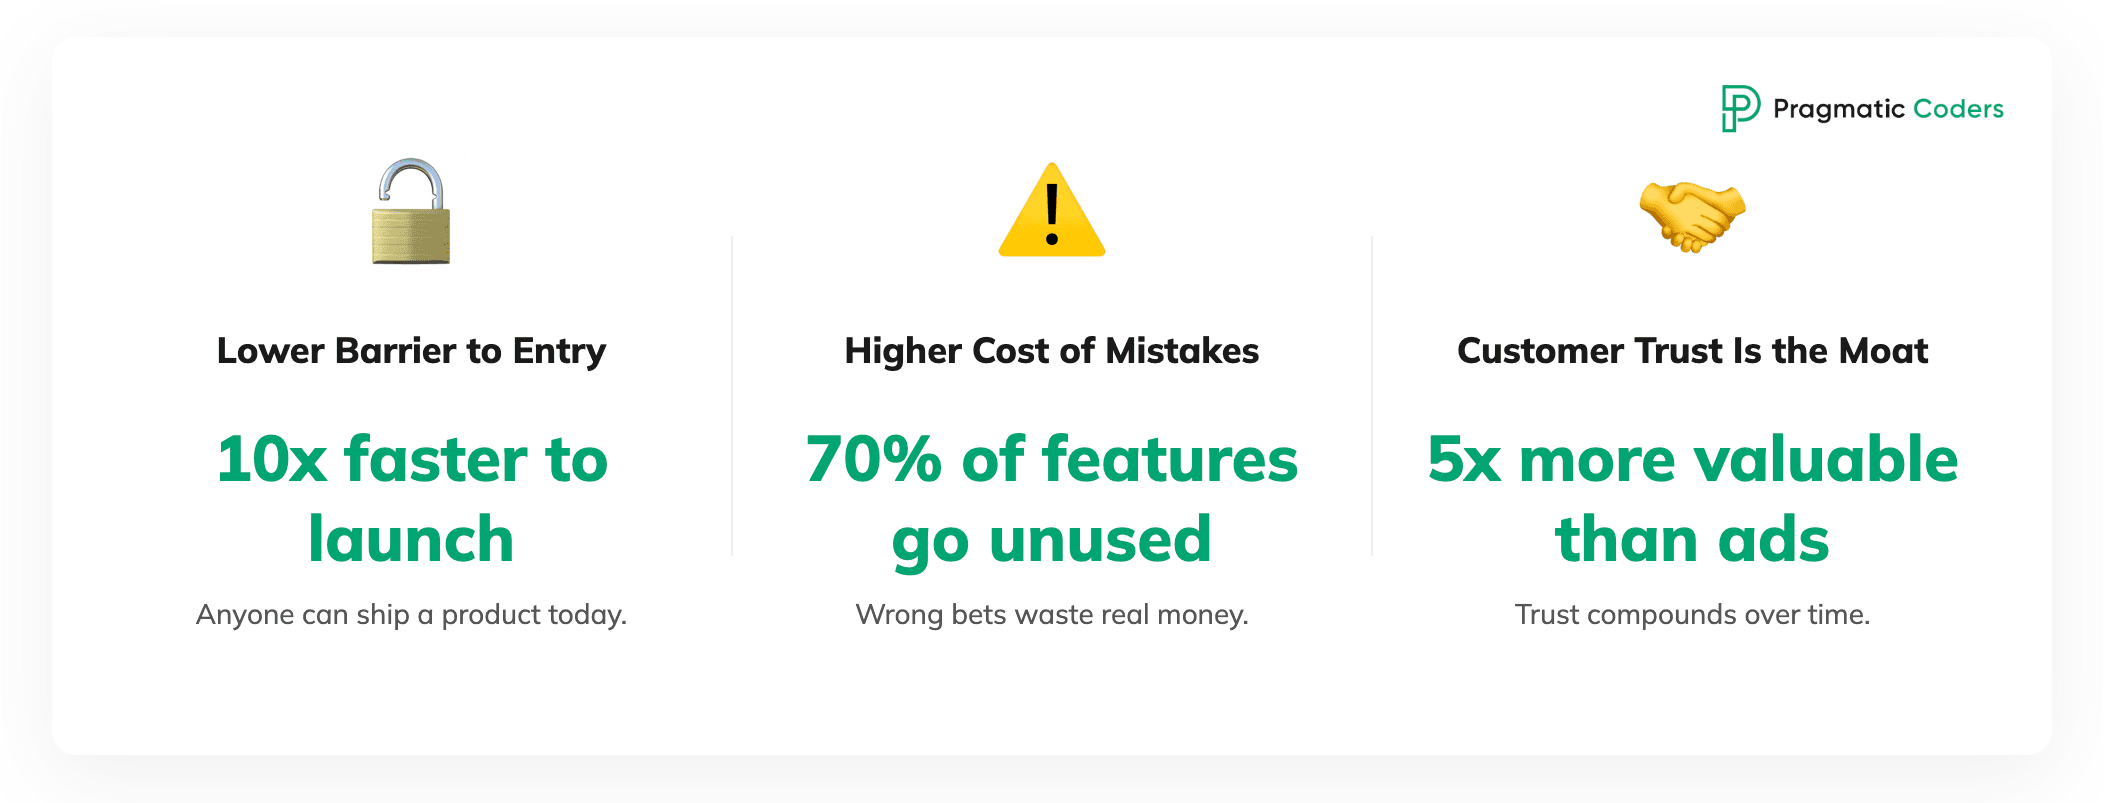
Three structural changes have raised the stakes for customer-centricity in the last decade.
The barriers to building have collapsed
Cloud infrastructure, no-code tools, off-the-shelf AI components, and global engineering markets mean that building a competent product is no longer a competitive moat. Two competitors can be in market with comparable functionality within weeks of each other. The differentiator has shifted from what you can build to how well you understand what to build.
This is the central paradox of modern product development: building has become easier while building the right thing has become harder. Speed of execution without accuracy of direction now produces faster failure, not faster growth.
The economics of getting it right are stark
The Berkley study of customer-centricity shows that companies operating at the highest customer-centricity maturity tier outgrow lower-maturity peers by a wide margin, with figures around 2.5x revenue growth.
The flip side is just as quantifiable. Industry data – most prominently the Standish Group’s CHAOS research and Pendo’s recurring Feature Adoption reports – consistently shows that the majority of shipped features see little or no use, with estimates ranging from over 60% to 80% depending on the dataset.
For a senior PM, this is the budget conversation that matters more than any other. Headcount is fixed. Sprint capacity is fixed. The only lever you control is what fraction of that capacity ends up creating customer-recognized value.
Customer trust is the durable asset
In categories where switching costs are low and information is abundant, the only durable competitive position is being the product that customers genuinely choose, recommend, and renew. That requires more than a good NPS score. It requires a track record of repeatedly building things that solve real problems for real users – and avoiding the moves that erode trust in the name of short-term metrics.
Peter Drucker phrased the underlying point sixty years ago: “The purpose of a business is to create a customer.” In Drucker’s framing, customer needs and business needs are not in tension. Profit is the by-product of serving the customer well, not an alternative to it. Customer-centric product development is the operational expression of that view.
The teams that internalize this make different decisions. They reject feature requests that would harm long-term trust for short-term conversions. They invest in problem framing before solution design. They measure success in outcomes, not output. They ship less, and what they ship matters more.
3. Three Foundational Schools Every Senior PM Should Master
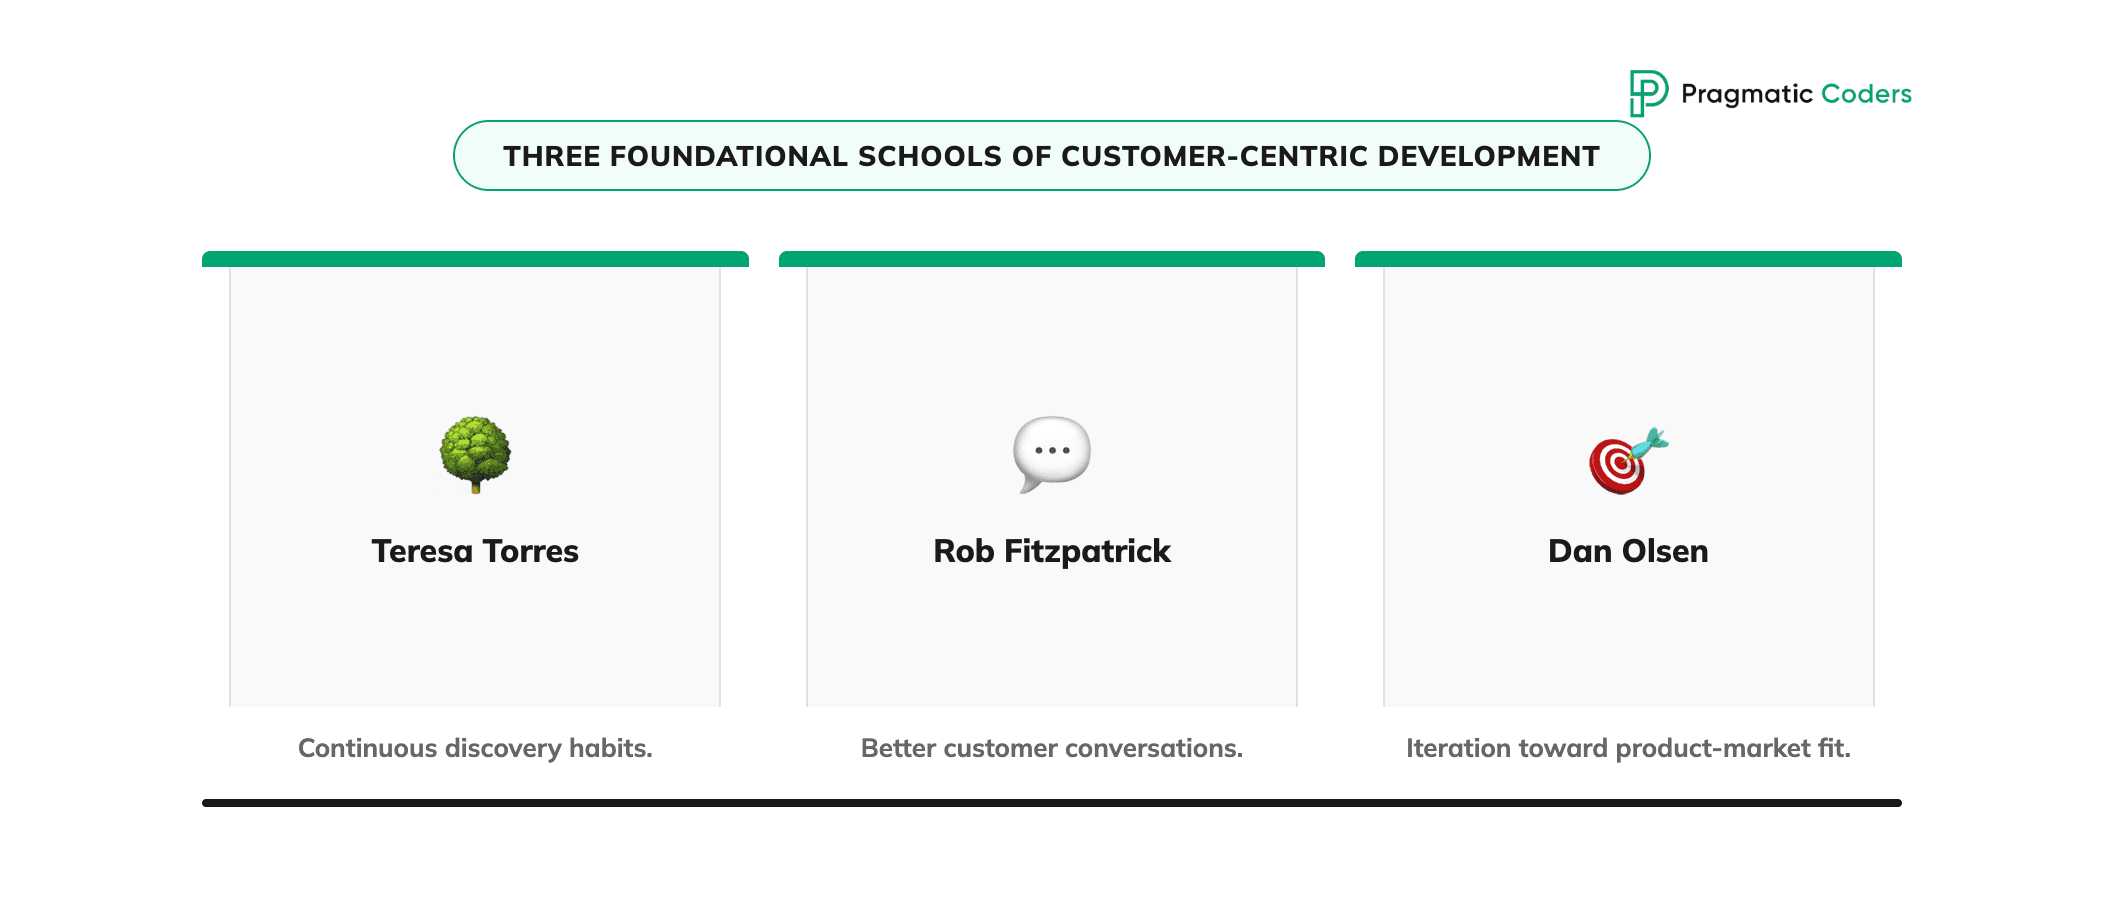
There are dozens of books on customer-centric work. Three of them, taken together, give you the full operating picture: how to run discovery as a continuous practice, how to extract truth from customer conversations, and how to structure the path from problem space to product-market fit.
Teresa Torres – Continuous Discovery Habits (2021)
Torres’ contribution is a rhythm and a structure for discovery work. The rhythm is deceptively simple: at minimum, weekly touchpoints with customers, conducted by the team building the product, in service of a clearly defined outcome. Not monthly. Not “when we have time.” Weekly. The point is not the volume of research; it is that daily product decisions stop being made on month-old understanding of the customer. The structure is the Opportunity Solution Tree (OST). You start with a single, measurable outcome. You map opportunities (customer needs, pains, desires) discovered through interviews. For each opportunity, you generate solutions. For each solution, you design experiments. The whole tree becomes the team’s shared reasoning artifact – the answer to “why are we building this and not something else?” Torres also pushes hard on the product trio: the idea that discovery decisions are made jointly by a product manager, a designer, and an engineer, not handed off in stages. Hand-offs collapse the shared context that makes good product decisions possible. | 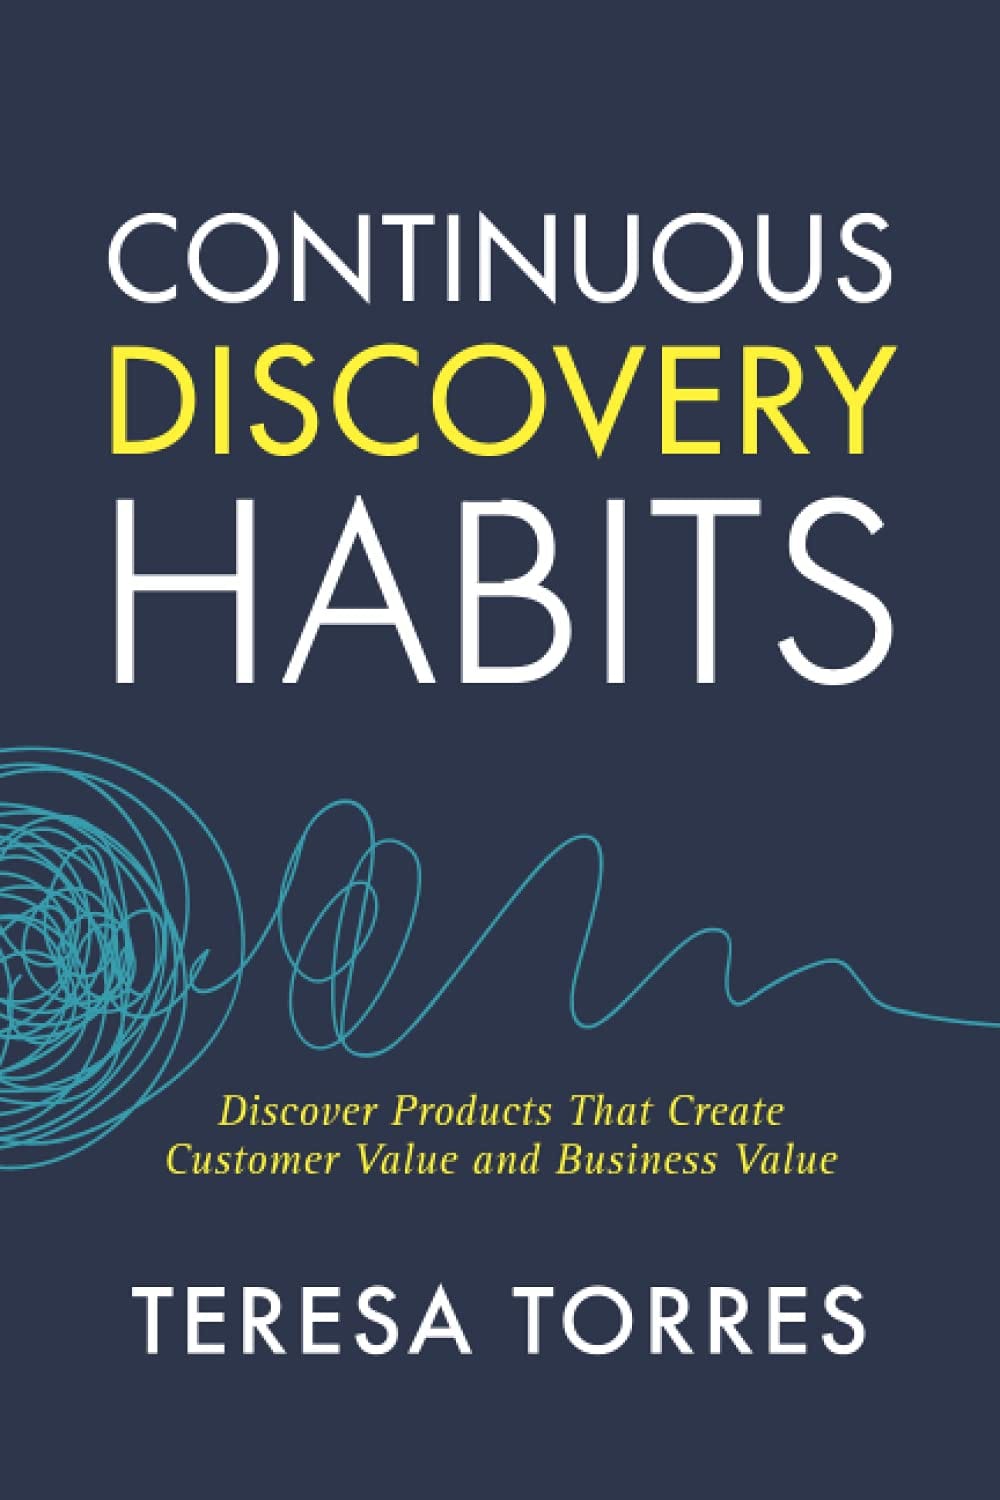 |
Rob Fitzpatrick – The Mom Test (2013)
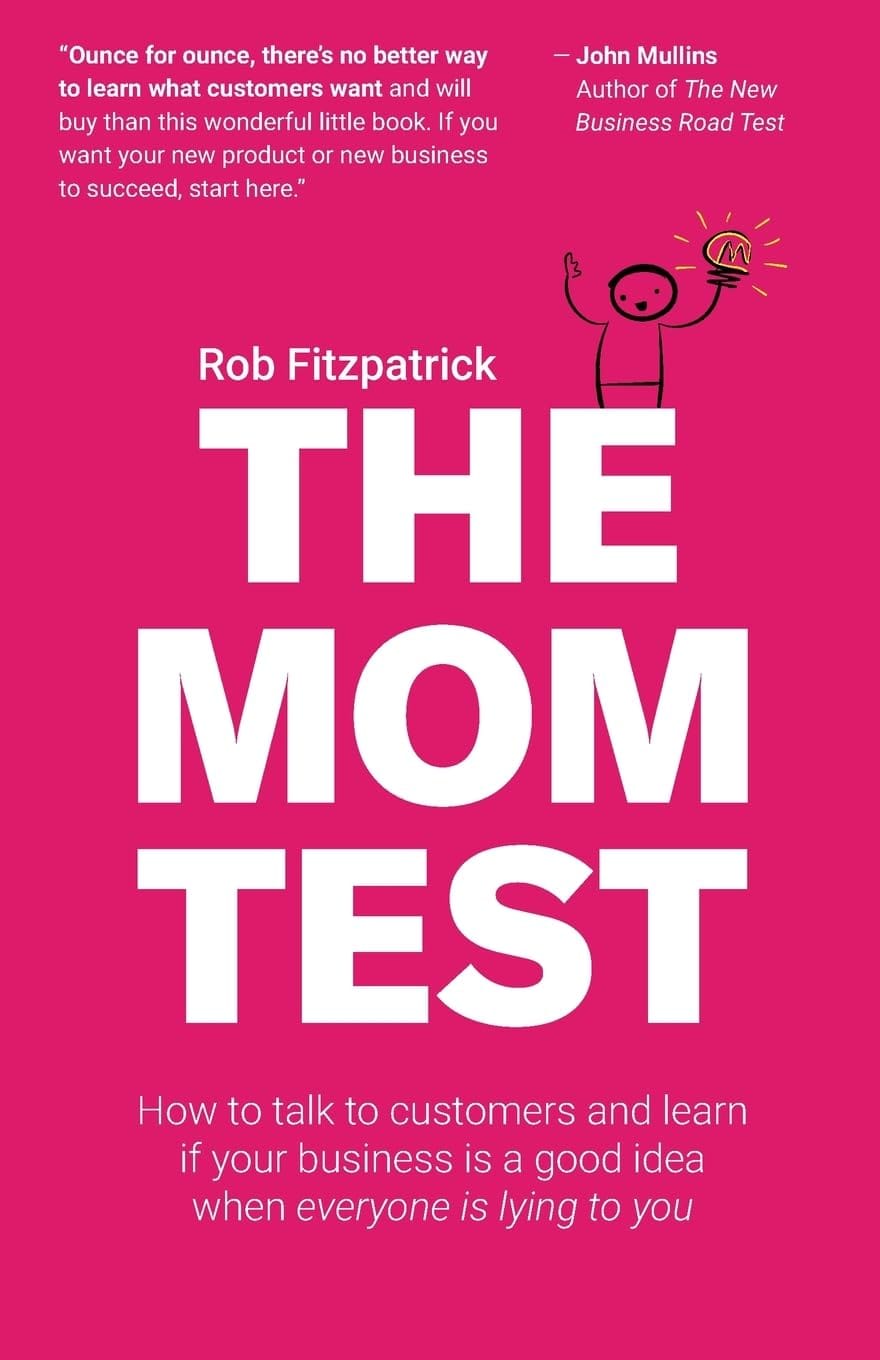 | The premise is that customer interviews routinely produce false positives. People are polite. They speculate about what they might want. They flatter your idea to be helpful. The data you collect feels like validation but is mostly noise. Worse than no signal – you act on it with confidence. The name “The Mom Test” comes from the idea that even your own mom will try to encourage you and give you polite, supportive answers – so if you can ask questions in a way that even your mother couldn’t just “be nice” and fake enthusiasm, you know the questions are robust. It’s a metaphor for asking questions that can’t simply be answered with politeness or flattery. The Mom Test is a set of three rules that filter out the noise:
|
“Would you use this?” becomes “When did you last face this problem? How did you handle it? What did it cost you?” The first question invites a courteous lie. The second produces facts.
Fitzpatrick adds a second concept that is just as important: commitment as the real signal. A customer saying “I’d love that” means almost nothing. A customer giving up something they value – time, reputation, money – is the only reliable evidence of intent. Pre-orders, paid pilots, intros to decision-makers, calendar bookings: these are the data points that should move your roadmap. Compliments are not.
Dan Olsen – The Lean Product Playbook (2015)
If Torres gives you the rhythm and Fitzpatrick gives you the filter, Olsen gives you the end-to-end process for moving from a customer hypothesis to product-market fit. The core artifact is the Product-Market Fit Pyramid, five layers stacked bottom to top:
The bottom three layers are problem space. The top two are solution space. The discipline Olsen demands is that you do not move into solution space until problem space is closed. This is the single hardest habit to build into a team that is rewarded for shipping. | 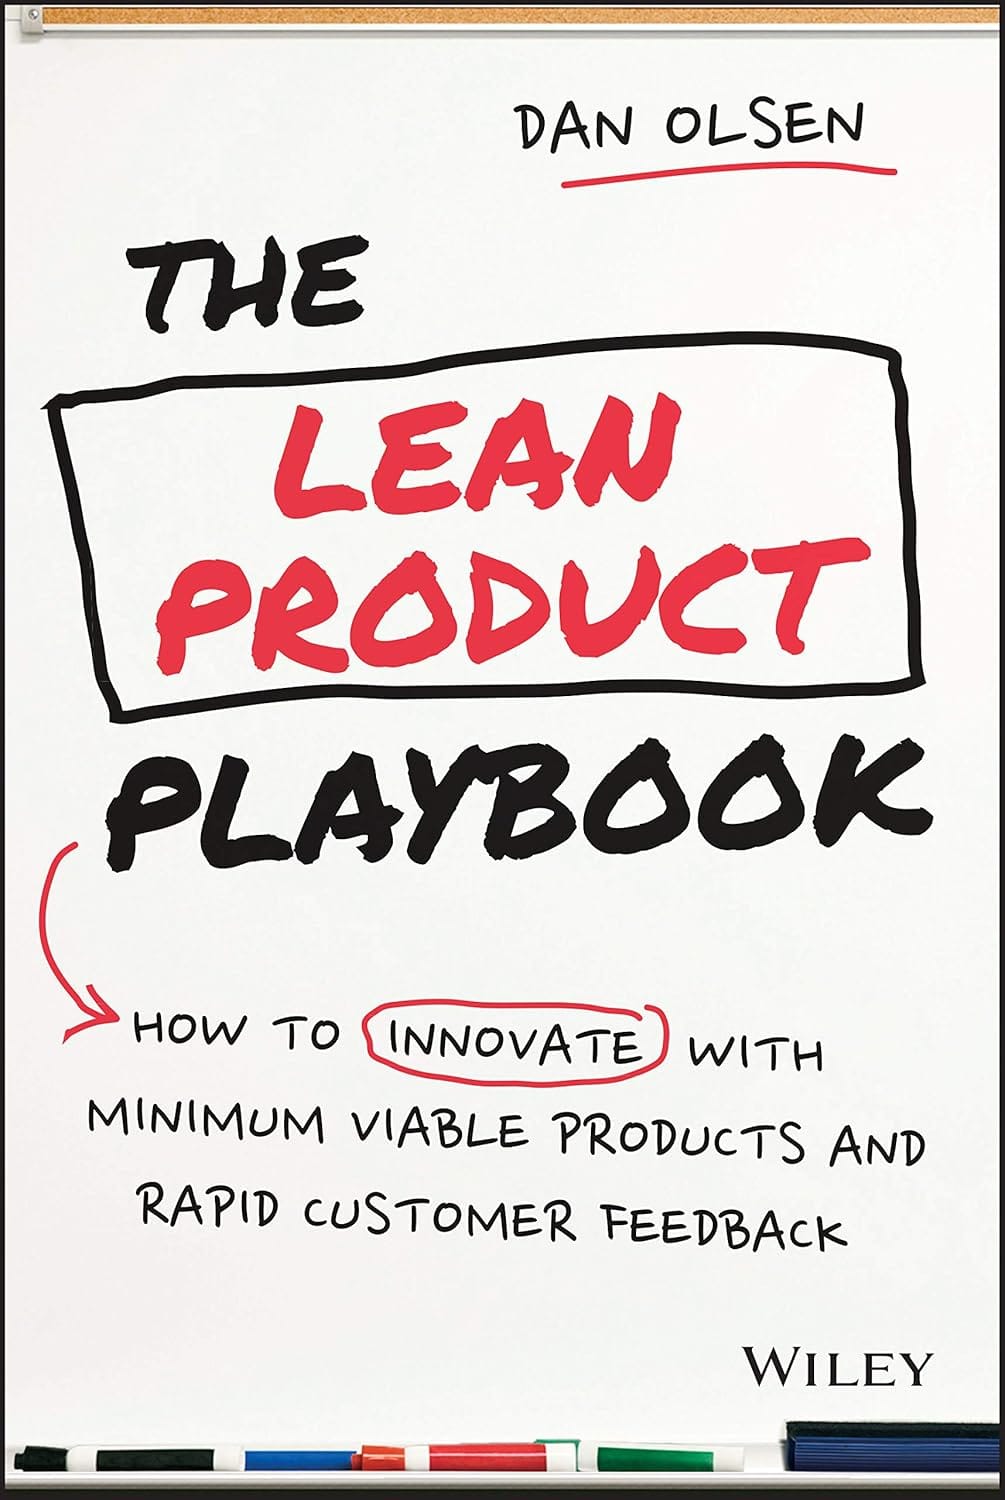 |
Around the pyramid, Olsen wraps the Lean Product Process: a six-step loop (target customer → underserved needs → value proposition → MVP feature set → MVP prototype → test and iterate). Each loop is a structured set of hypotheses to validate, not a project to deliver. MVPs in his framing are not “small versions of the product”; they are the smallest thing you can build to test the riskiest assumption.
Olsen also draws heavily on Outcome-Driven Innovation (Anthony Ulwick) for prioritizing needs: look for the needs with high importance and low satisfaction. That is where the largest gap between customer pain and existing supply sits – and therefore where customer-recognized value is easiest to create.
Three lenses, one practice
These three frameworks are often discussed in isolation. In practice, they are complementary lenses on the same problem.
| Torres | Fitzpatrick | Olsen | |
|---|---|---|---|
| Primary contribution | Cadence and decision structure | Quality of customer evidence | End-to-end process to PMF |
| Core artifact | Opportunity Solution Tree | The Mom Test rules | Product-Market Fit Pyramid |
| Main risk it addresses | Discovery becomes a one-off project | Customer conversations produce false positives | Teams jump to solutions before understanding the problem |
| Best applied at | Weekly product trio rhythm | Every customer touchpoint | Every initiative or product bet |
| Strongest signal | Outcome metric movement | Customer commitment (time, reputation, money) | Product-market fit metrics (retention, willingness to pay) |
A senior PM who runs all three in parallel is operating at a different level than a PM who runs any one of them in isolation. Which is exactly what we will build in the next section.
4. The Synthesis: A Unified Customer-Centric Decision Framework
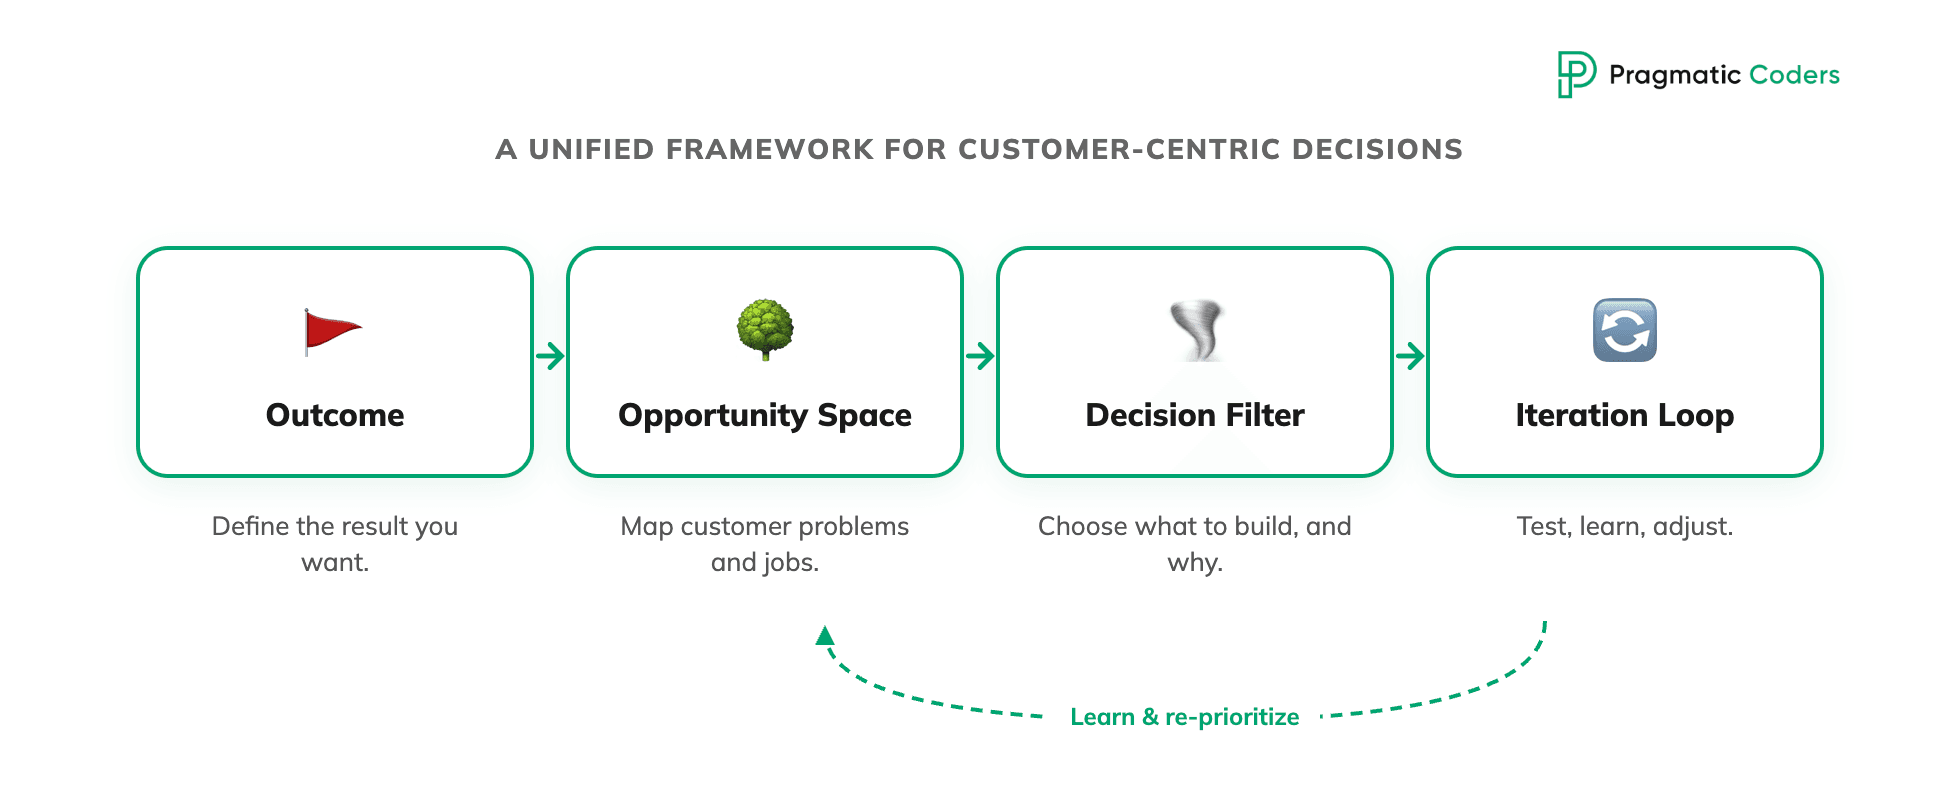
The three books above are not competing methodologies. They sit at different points in the same workflow. Here is how they fit together as one operating model.
One outcome. One opportunity space. One filter. One process.
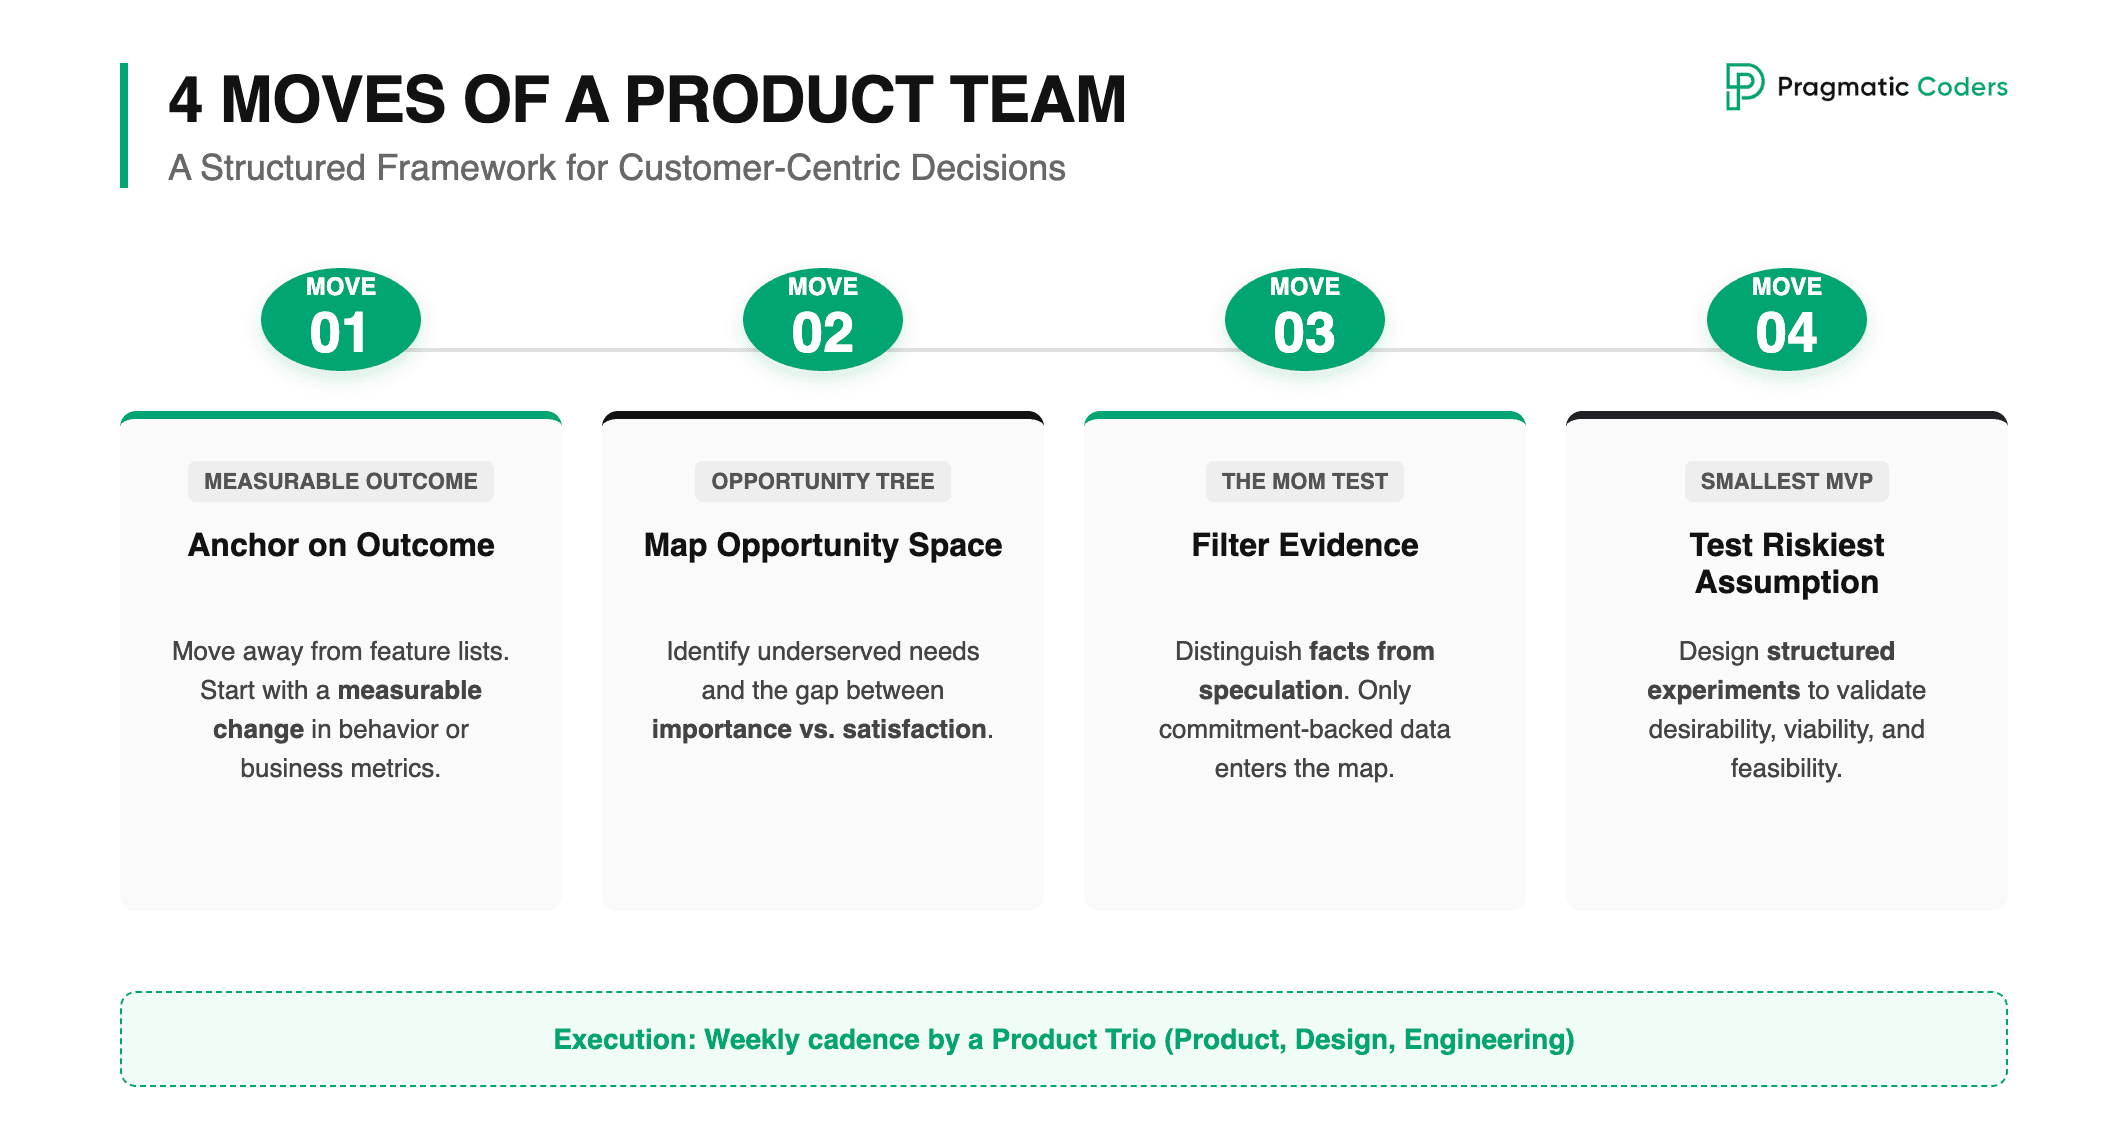
A customer-centric product team makes decisions in four explicit moves. Each move corresponds to one of the books – and each move has a concrete artifact.
Move 1 – Anchor on an outcome (Torres). Every initiative starts with a measurable outcome the team owns. Not a feature list. Not a roadmap commitment. A change in customer behavior or business metric the team is accountable for moving. The outcome scopes everything that follows. If you cannot name the outcome, you are not yet ready to start.
Move 2 – Map the opportunity space (Torres + Olsen). With the outcome fixed, the team explores the problem space: who exactly is the customer, what are their underserved needs, where is the gap between importance and current satisfaction. This work lives on an Opportunity Solution Tree (Torres) anchored in a Product-Market Fit Pyramid (Olsen). The output is not a list of features. It is a structured map of the customer problems that, if solved, would move the outcome.
Move 3 – Apply the Mom Test filter (Fitzpatrick). Every input to the opportunity map – every interview, every survey, every support ticket pattern, every sales call – passes through the Mom Test. Was the customer talking about facts from their actual life, or speculating about your idea? Did they give a compliment or a commitment? If the evidence does not survive that filter, it does not enter the map. This is the discipline that prevents the team from building a beautifully structured tree on top of polite fiction.
Move 4 – Test the riskiest assumption with the smallest possible MVP (Olsen). Once the map points to a candidate solution, the team identifies the riskiest assumption it depends on (desirability, viability, feasibility, usability, or ethics) and designs the smallest possible test for it. The MVP is not a small product. It is a structured experiment. The result either validates the path forward or sends the team back to update the opportunity map.
These four moves run on the weekly cadence Torres prescribes, conducted by a product trio that includes engineering and design – not by a PM operating alone with a research deck.
What changes in your week
When this framework is alive in a team, the operating signature is recognizable.
- Standups start with “what did we learn from a customer this week?” before “what are you working on?”
- Backlog grooming rejects items that cannot be tied back to a node on the opportunity map.
- Sprint reviews report on outcome movement and customer evidence, not feature counts.
- Roadmap conversations with stakeholders reference the Opportunity Solution Tree (OST), mapping initiatives to customer opportunities and outcomes, rather than relying on traditional project timelines like Gantt charts.
- MVPs are scoped by the assumption they test, not by what looks releasable.
If your team currently does none of those things, the gap between you and the top 10% of customer-centric teams is not a budget problem. It is a workflow problem – and it is fixable in one quarter without hiring anyone.
Where this article goes from here
The remaining sections give you the operational detail to install this practice:
- A six-step process you can run on your next initiative (Section 5).
- The anti-patterns that quietly destroy customer-centric programs (Section 6).
- The customer-centric metrics – and the warning metrics that protect you from gaming them (Section 7).
- A short audit you can run with your trio this week, plus a deeper assessment if you want to score every dimension of product health (Section 8).
- Frequently asked questions, answered briefly and without hedging (Section 9).
5. A Six-Step Customer-Centric Process You Can Run on Your Next Initiative
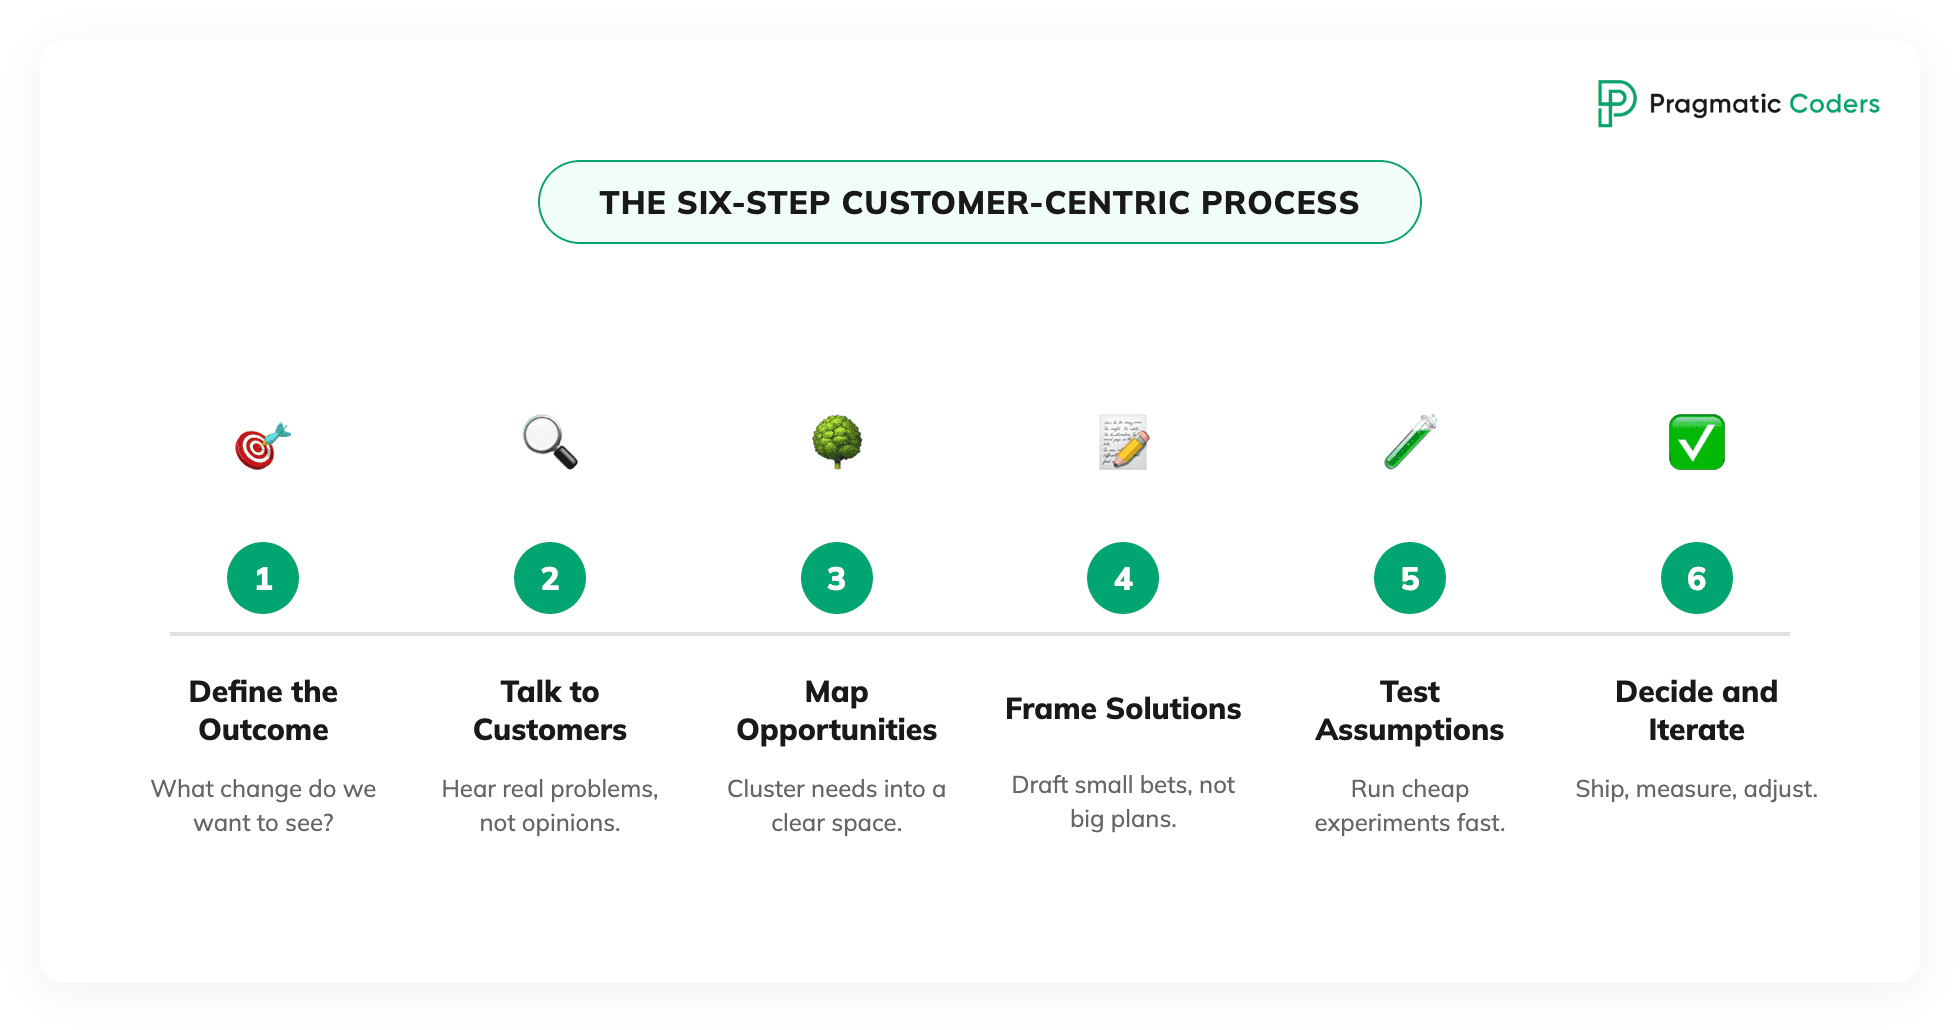
The framework above describes the operating model. This section translates it into a concrete sequence you can run on any initiative – a new product, a new feature, a re-platforming, a pricing change. Each step has one job, one common failure mode, and one signal that tells you whether you have done it well enough to move on.
Step 1 – Define the outcome you are accountable for
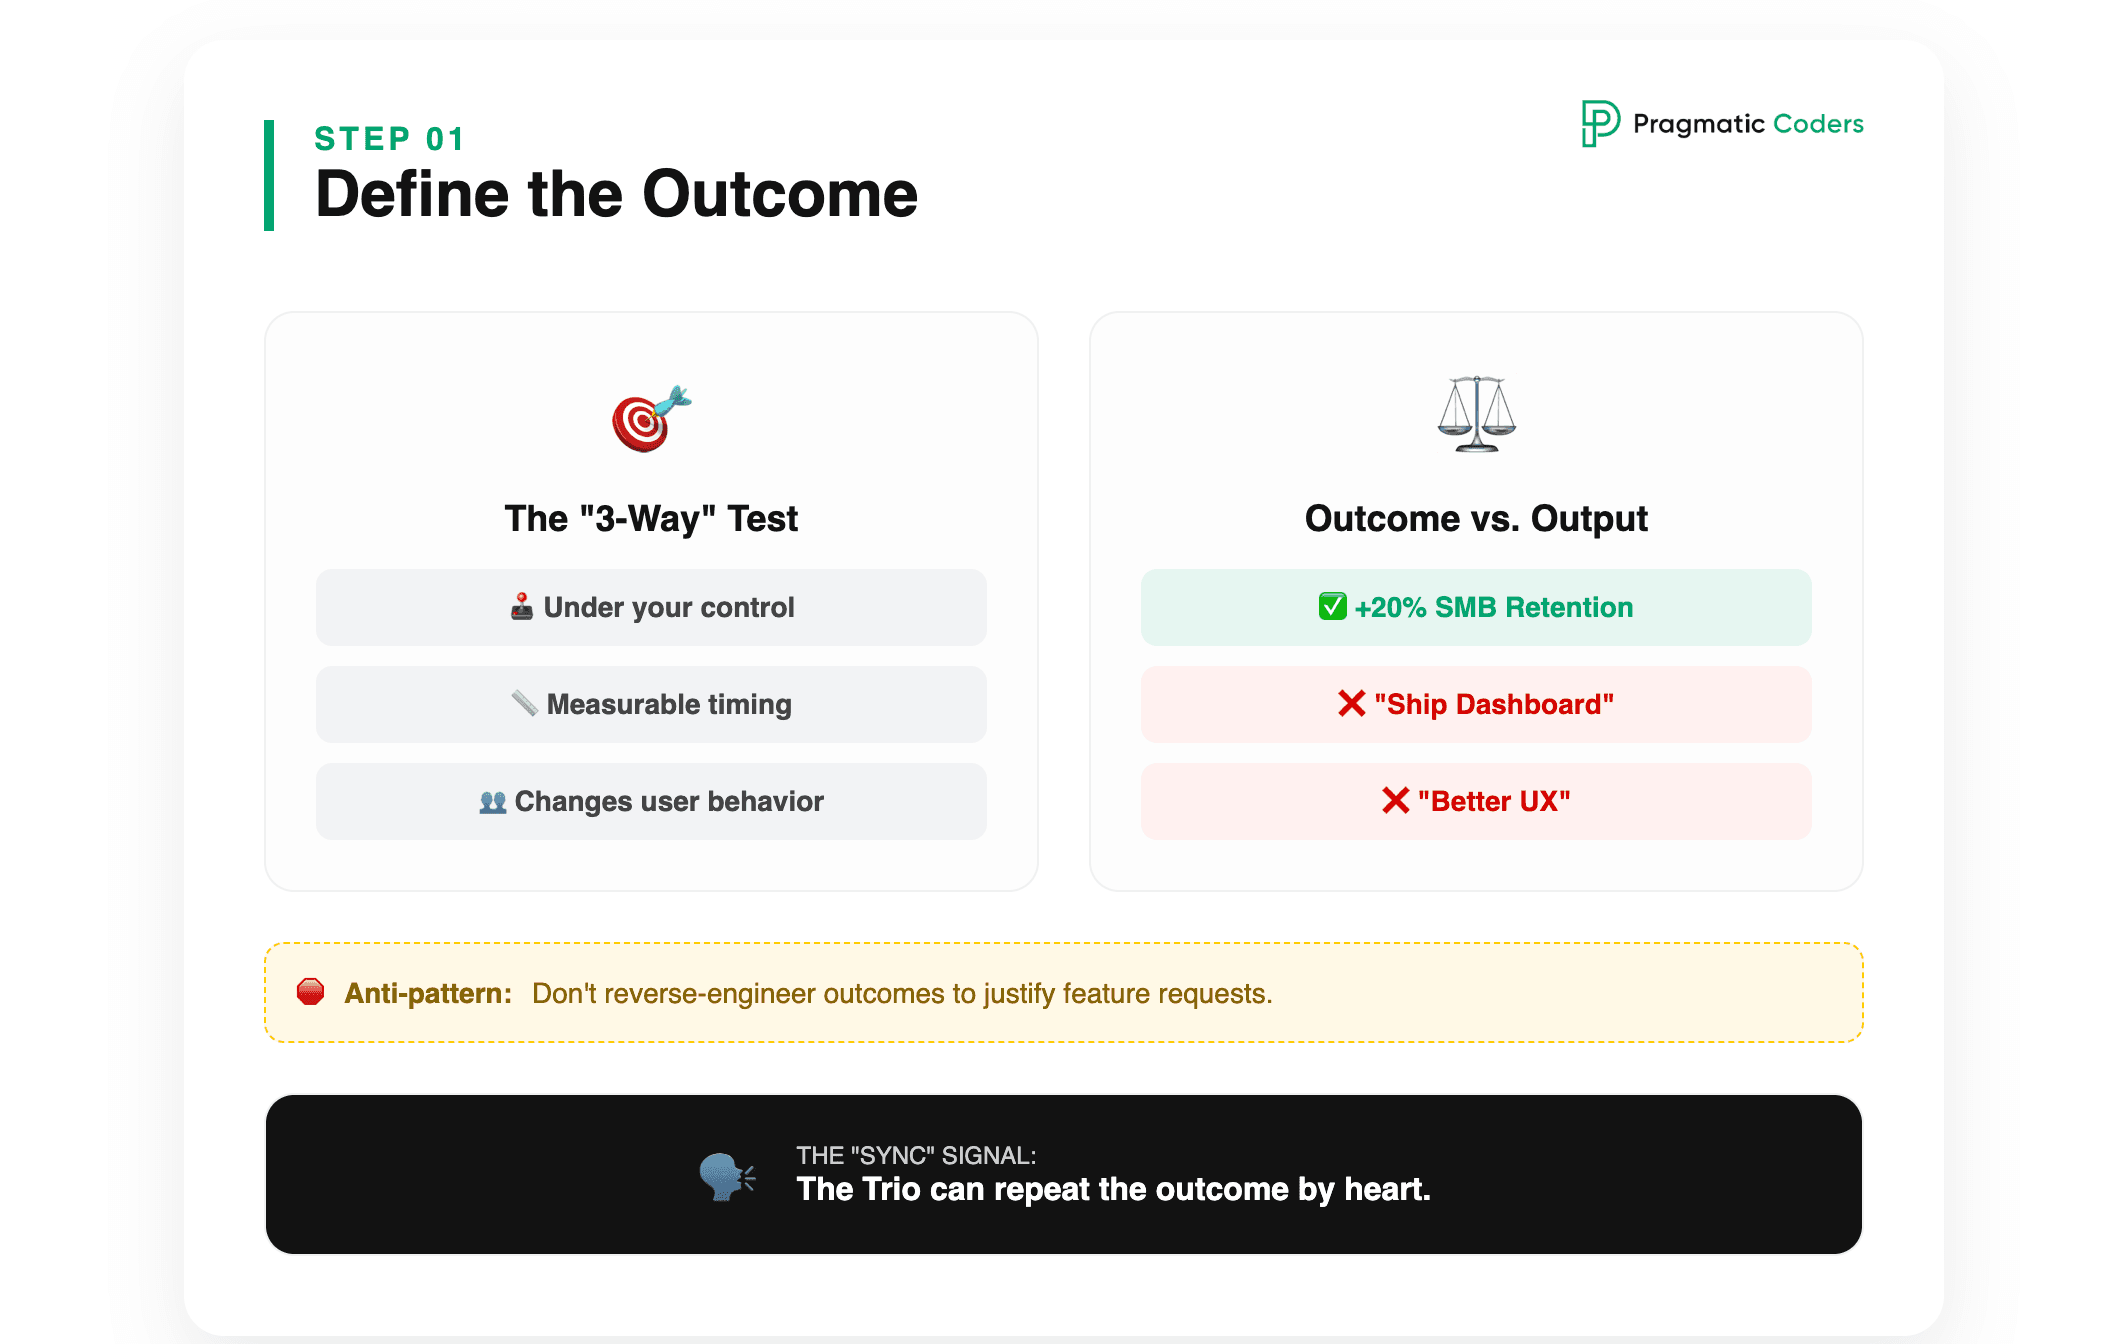
Before anything else, name the outcome. Not the feature. Not the deliverable. The change in customer behavior or business metric the team owns and is judged on.
A useful outcome has three properties: it sits within the team’s span of control, it is measurable on a meaningful timescale, and it forces a customer-side change rather than just an internal one. “Increase weekly active users in the SMB segment by 20% in two quarters” is an outcome. “Ship the new dashboard” is not. “Improve customer satisfaction” is too vague to be useful.
Common mistake: accepting a feature request from leadership as the starting point and reverse-engineering an outcome to justify it. This is how teams build sophisticated post-hoc narratives around work that never had a strategic basis.
Signal you are done: every member of the trio can repeat the outcome in one sentence without looking at a doc.
Step 2 – Define your target customer with enough precision to find them
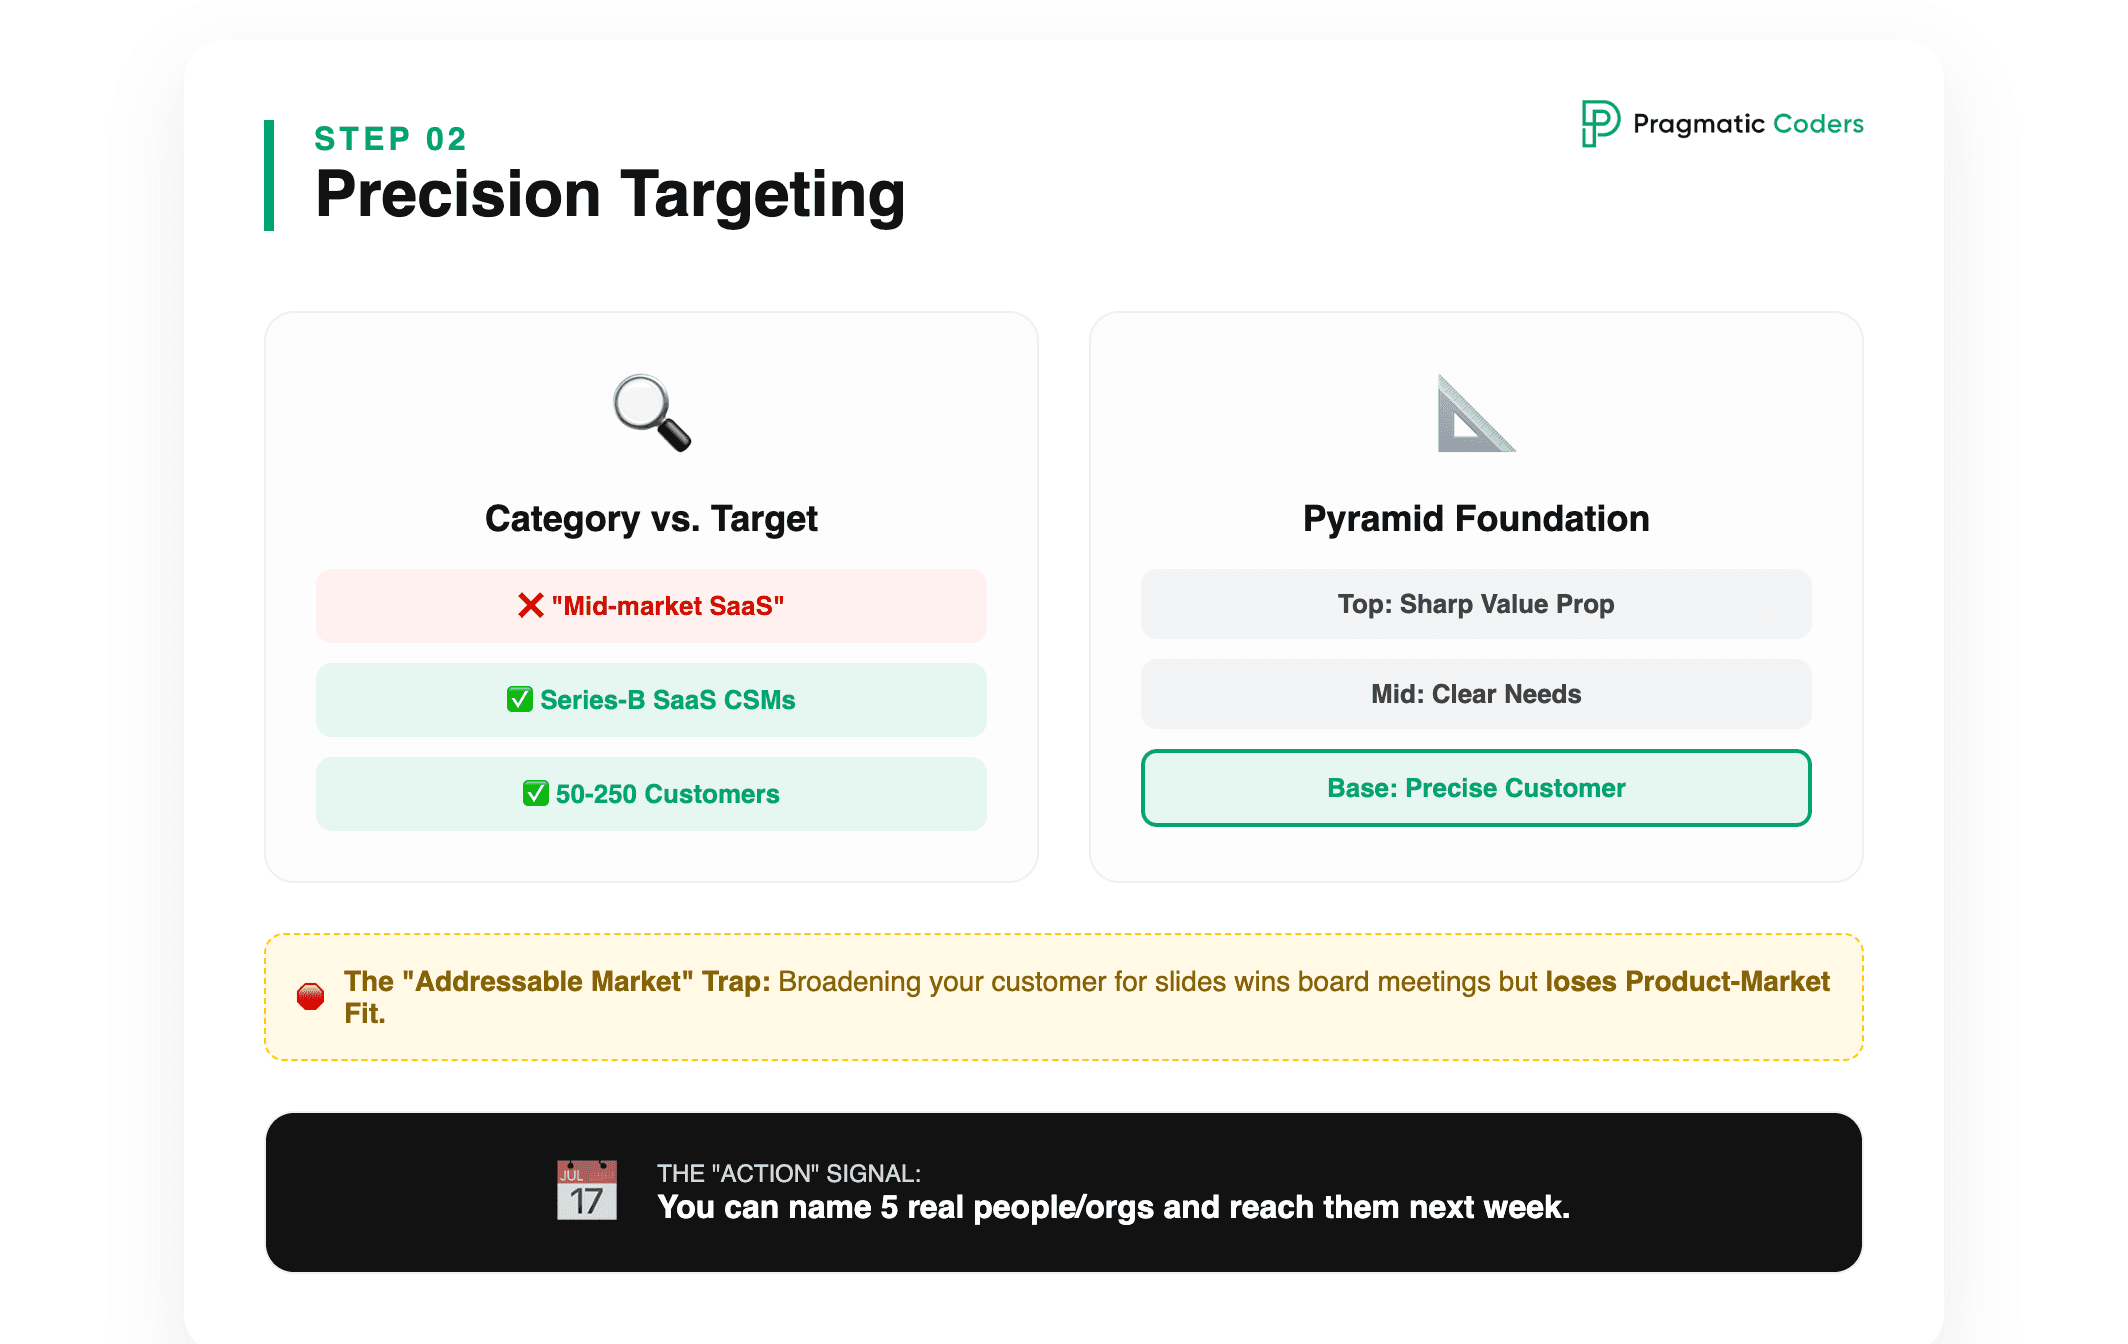
A target customer that cannot be located in the real world is a hypothesis nobody can test. “Mid-market SaaS companies” is a category, not a target. “Heads of Customer Success (CSM: Customer Success Manager) at Series-B SaaS companies in North America with 50–250 paying customers and a Customer Success team of 3–10” is a target you can recruit, interview, and measure.
This is the bottom layer of Olsen’s Product-Market Fit Pyramid for a reason. Every layer above it gets sharper or fuzzier depending on the precision here. Teams that skip this step end up with feedback that contradicts itself, because they are unknowingly listening to several different segments at once and treating them as one.
Common mistake: defining the customer as broadly as possible to maximize the addressable market on a slide. This wins board meetings and loses product-market fit.
Signal you are done: you can name three to five real organizations or individuals who fit the profile, and you can describe how to reach them next week.
Step 3 – Map the opportunity space before generating solutions
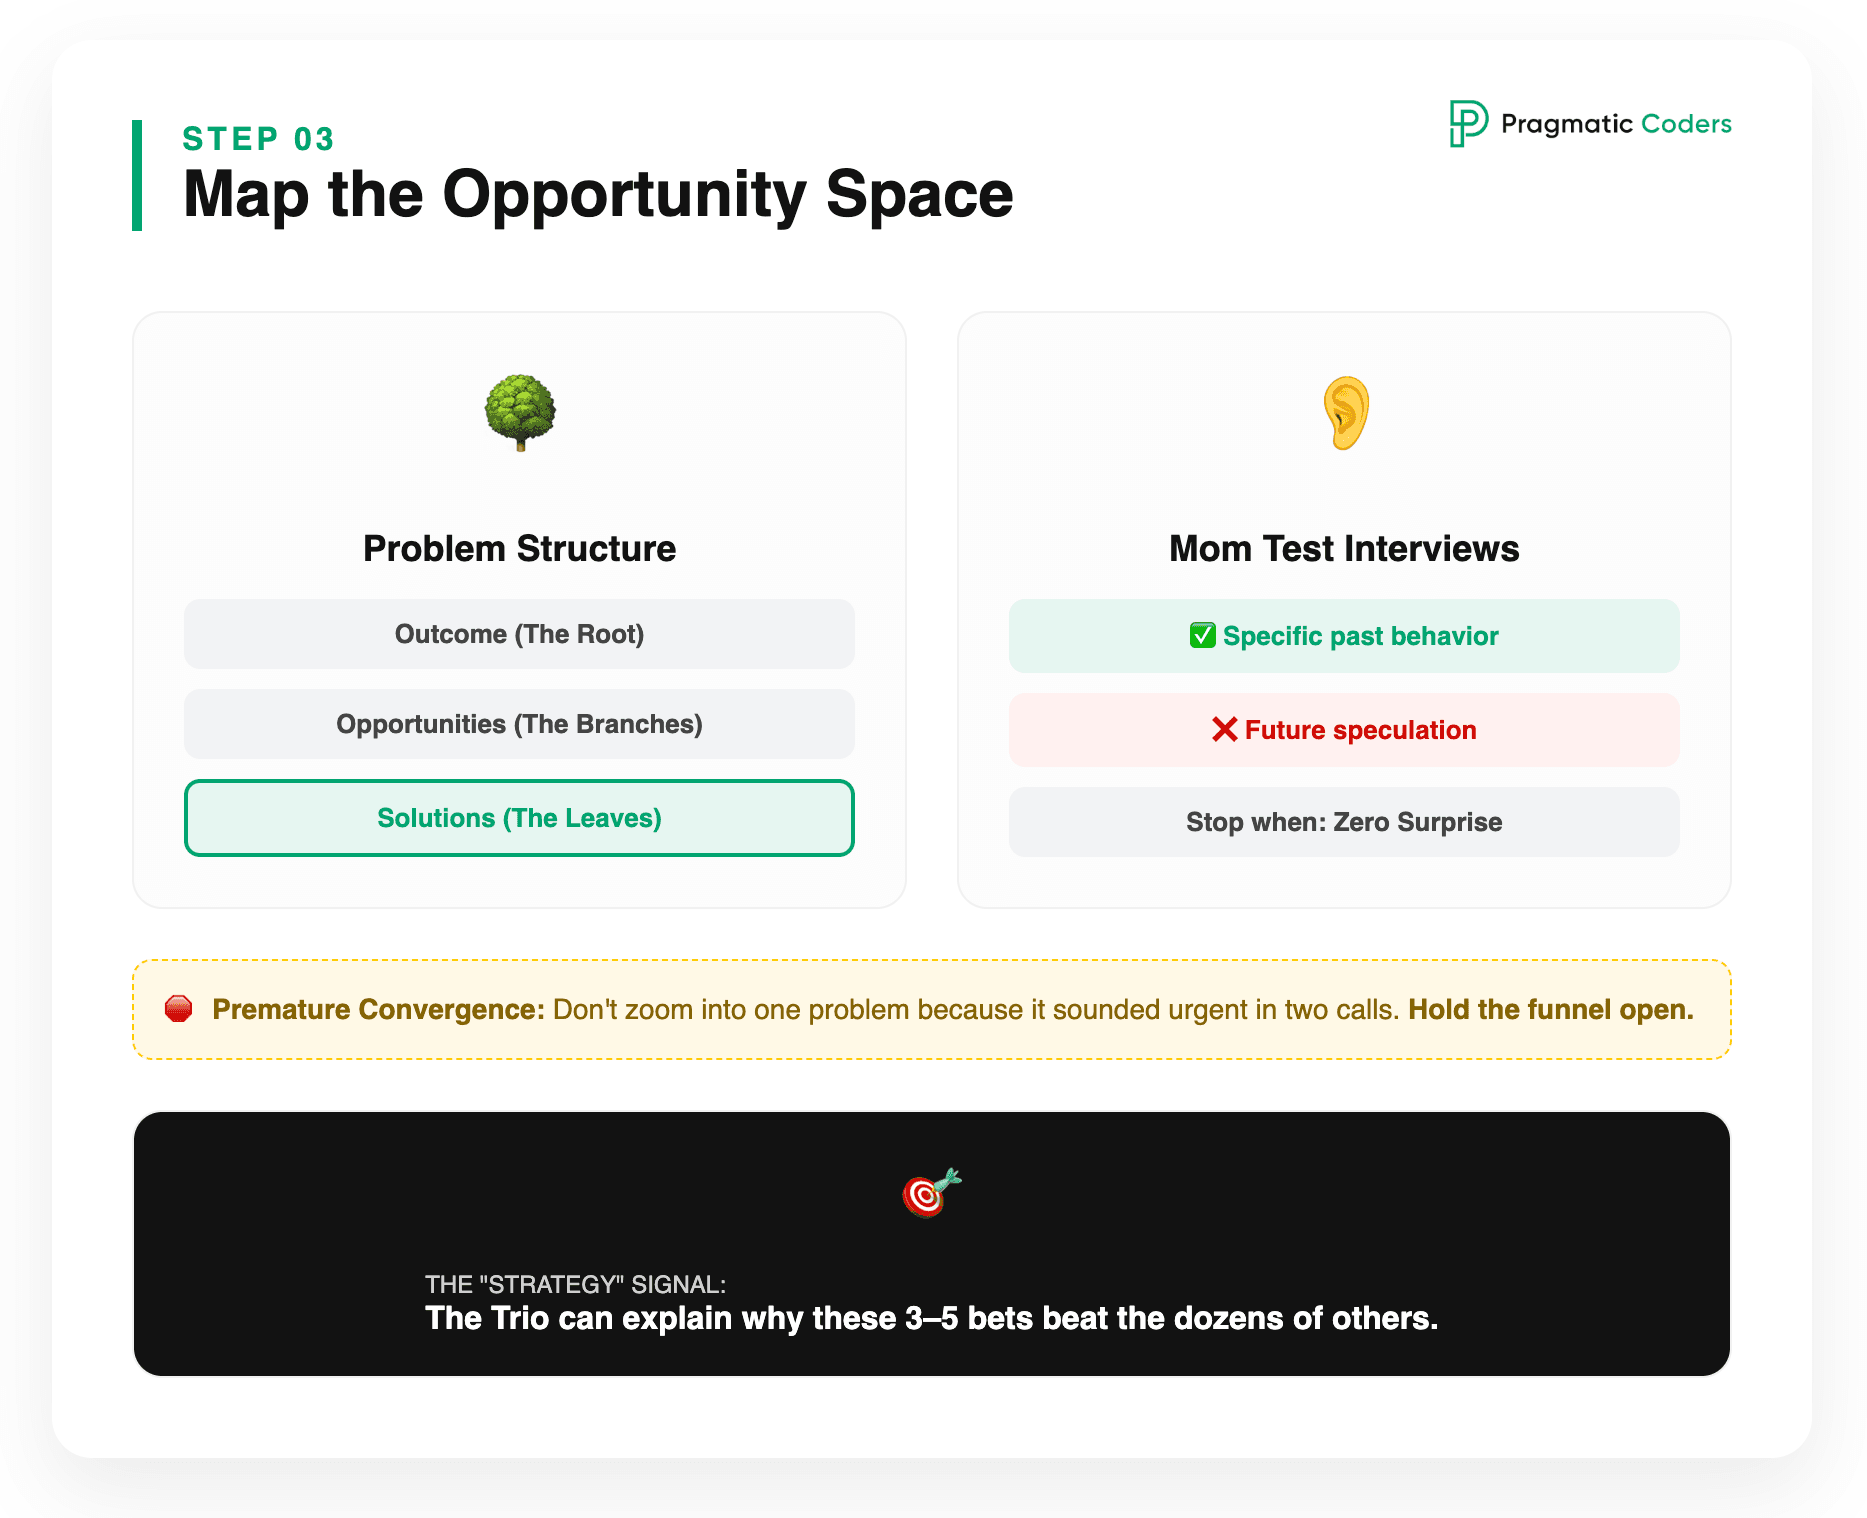
This is where most teams collapse the funnel too early. The natural impulse is to hear a customer pain, sketch a feature, and move into design. The customer-centric move is the opposite: hold the problem space open long enough to see its actual shape.
Run weekly interviews with the segment, applying the Mom Test rules. Talk about their life, ask for specifics in the past, listen more than you talk. Capture what comes out as opportunities – needs, pains, desires – and structure them on an Opportunity Solution Tree under the outcome from Step 1.
The point is not to interview until you have an answer. The point is to interview until the structure of the problem space stops surprising you. When new conversations stop adding new branches and only confirm existing ones, you have enough.
Common mistake: prematurely zooming into a single problem because it sounds urgent in one or two interviews. Discovery practitioners commonly call this premature convergence – treating two interviews as enough signal to commit. It produces high-confidence work on problems that are not actually priorities for the customer.
Signal you are done: the trio can point at the Opportunity Solution Tree and explain, in one sentence each, the three to five most important opportunities and why those – not the dozens of others – are the bets worth pursuing.
Step 4 – Frame the problem in customer language, not KPI language
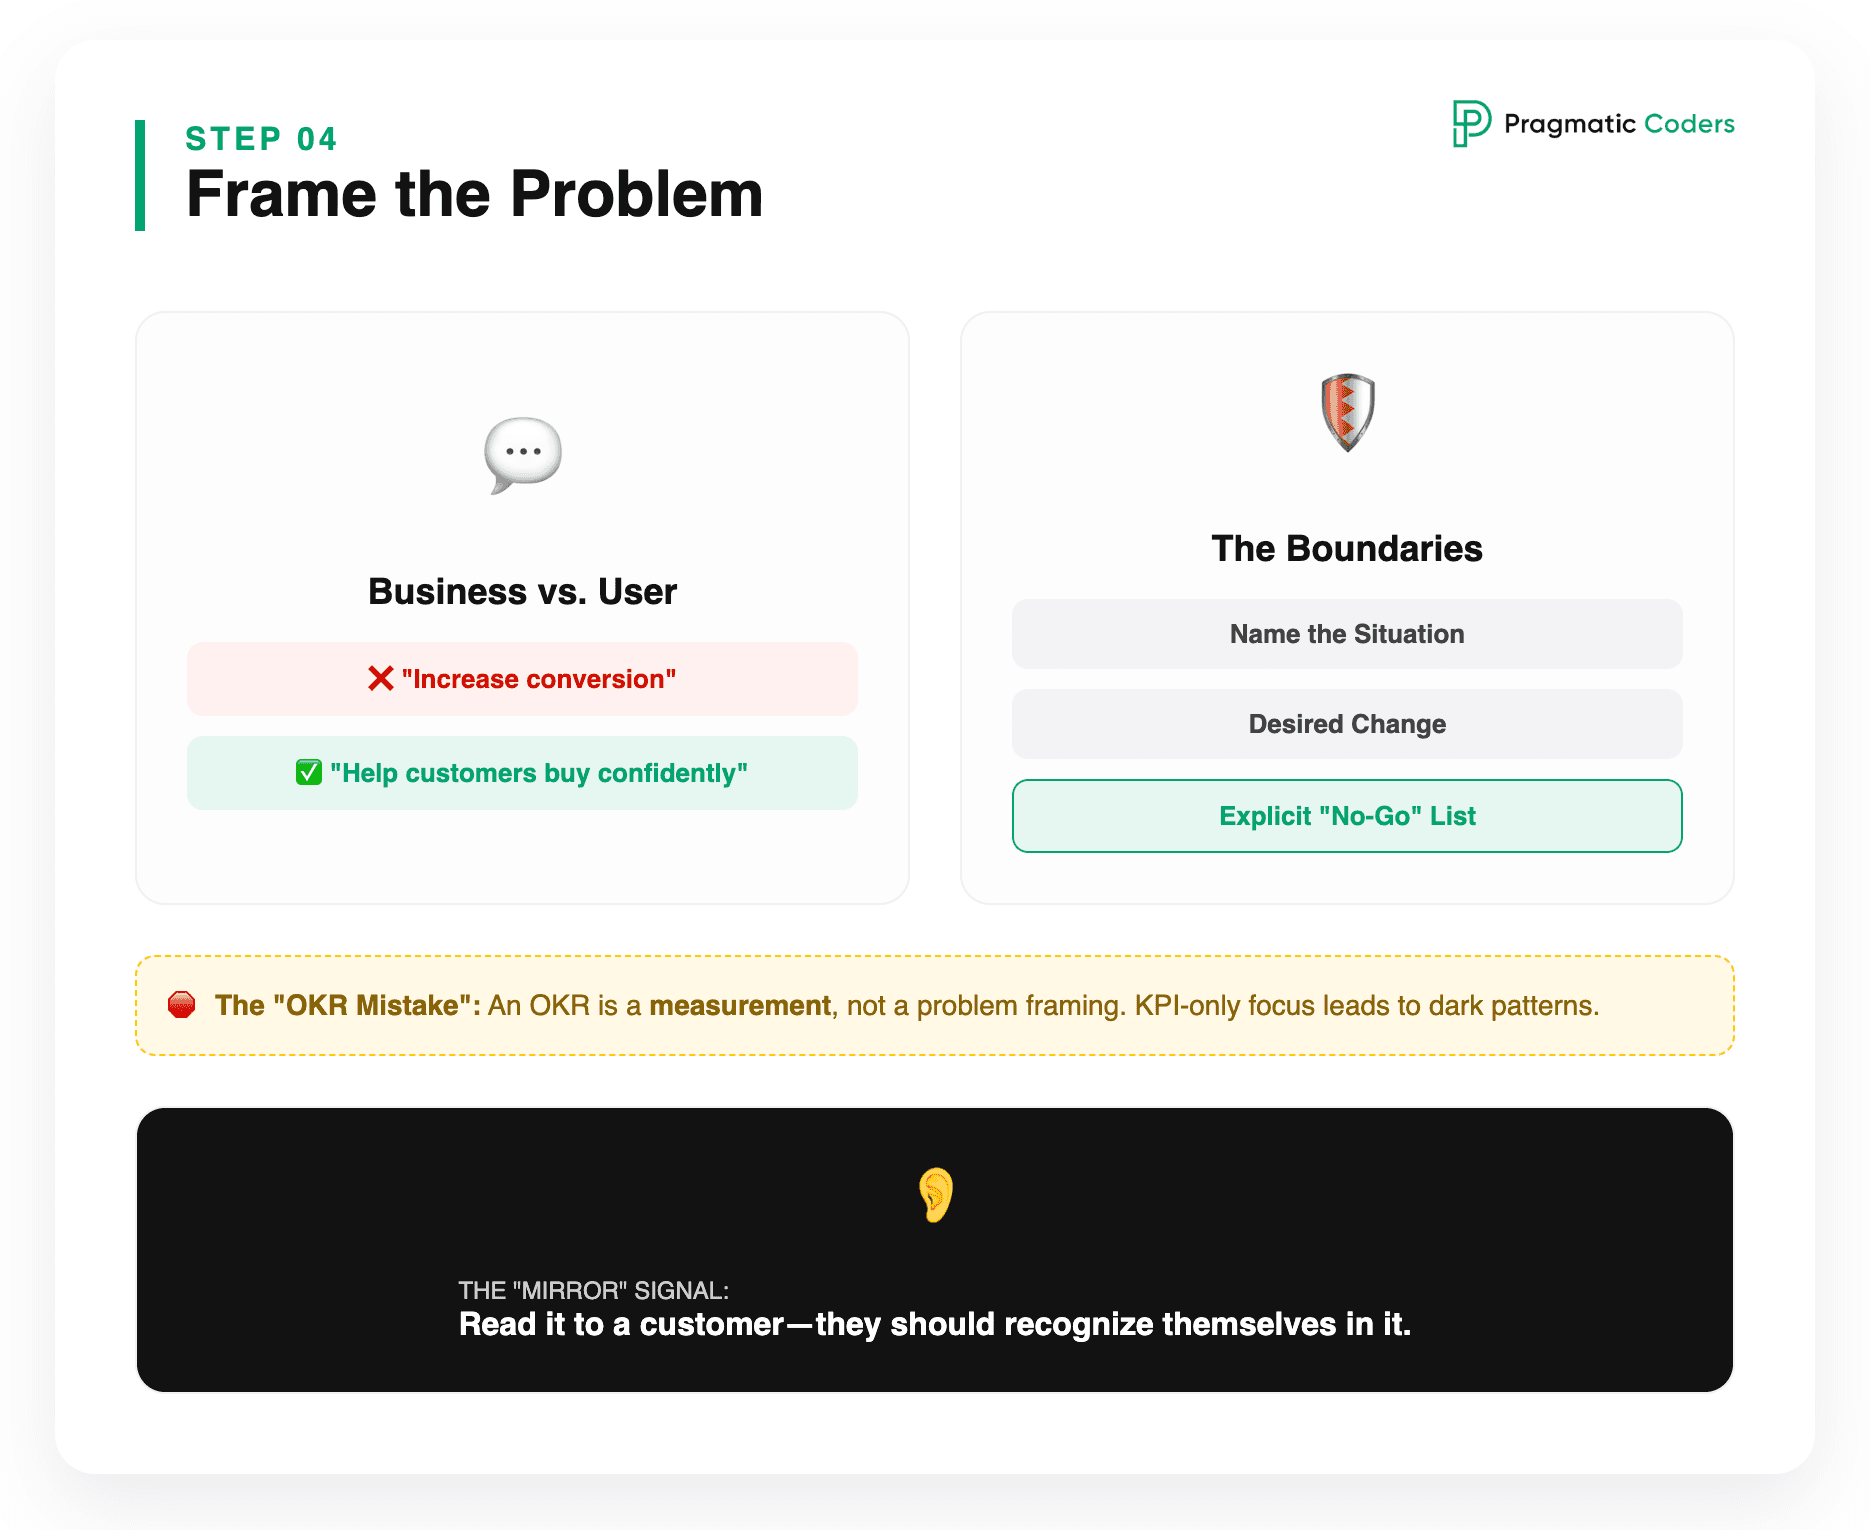
Before moving into solutions, write down the problem you are about to solve in the customer’s words. Not in the language of your business metric.
This sounds cosmetic. It is not. Problem framing determines what kinds of solutions the team will generate. “Increase checkout conversion by 15%” will produce one set of ideas – most of them coercive. “Help customers complete checkout quickly and confidently, without surprises” will produce a fundamentally different set. The metric is the same; the moral and product space is not.
A well-framed problem statement names the segment, the situation, the desired customer-side change, and the boundaries you will not cross. The boundaries matter most. They are the explicit no-go list that keeps the team honest when business pressure rises.
Common mistake: skipping this step because “we already have the OKR.” The OKR is a measurement instrument. It is not a problem framing. Treating the two as interchangeable is how teams end up shipping dark patterns that move the metric and damage the brand.
Signal you are done: the framed problem could be read aloud to a customer and they would recognize themselves in it.
Step 5 – Identify and test the riskiest assumption with the smallest possible MVP
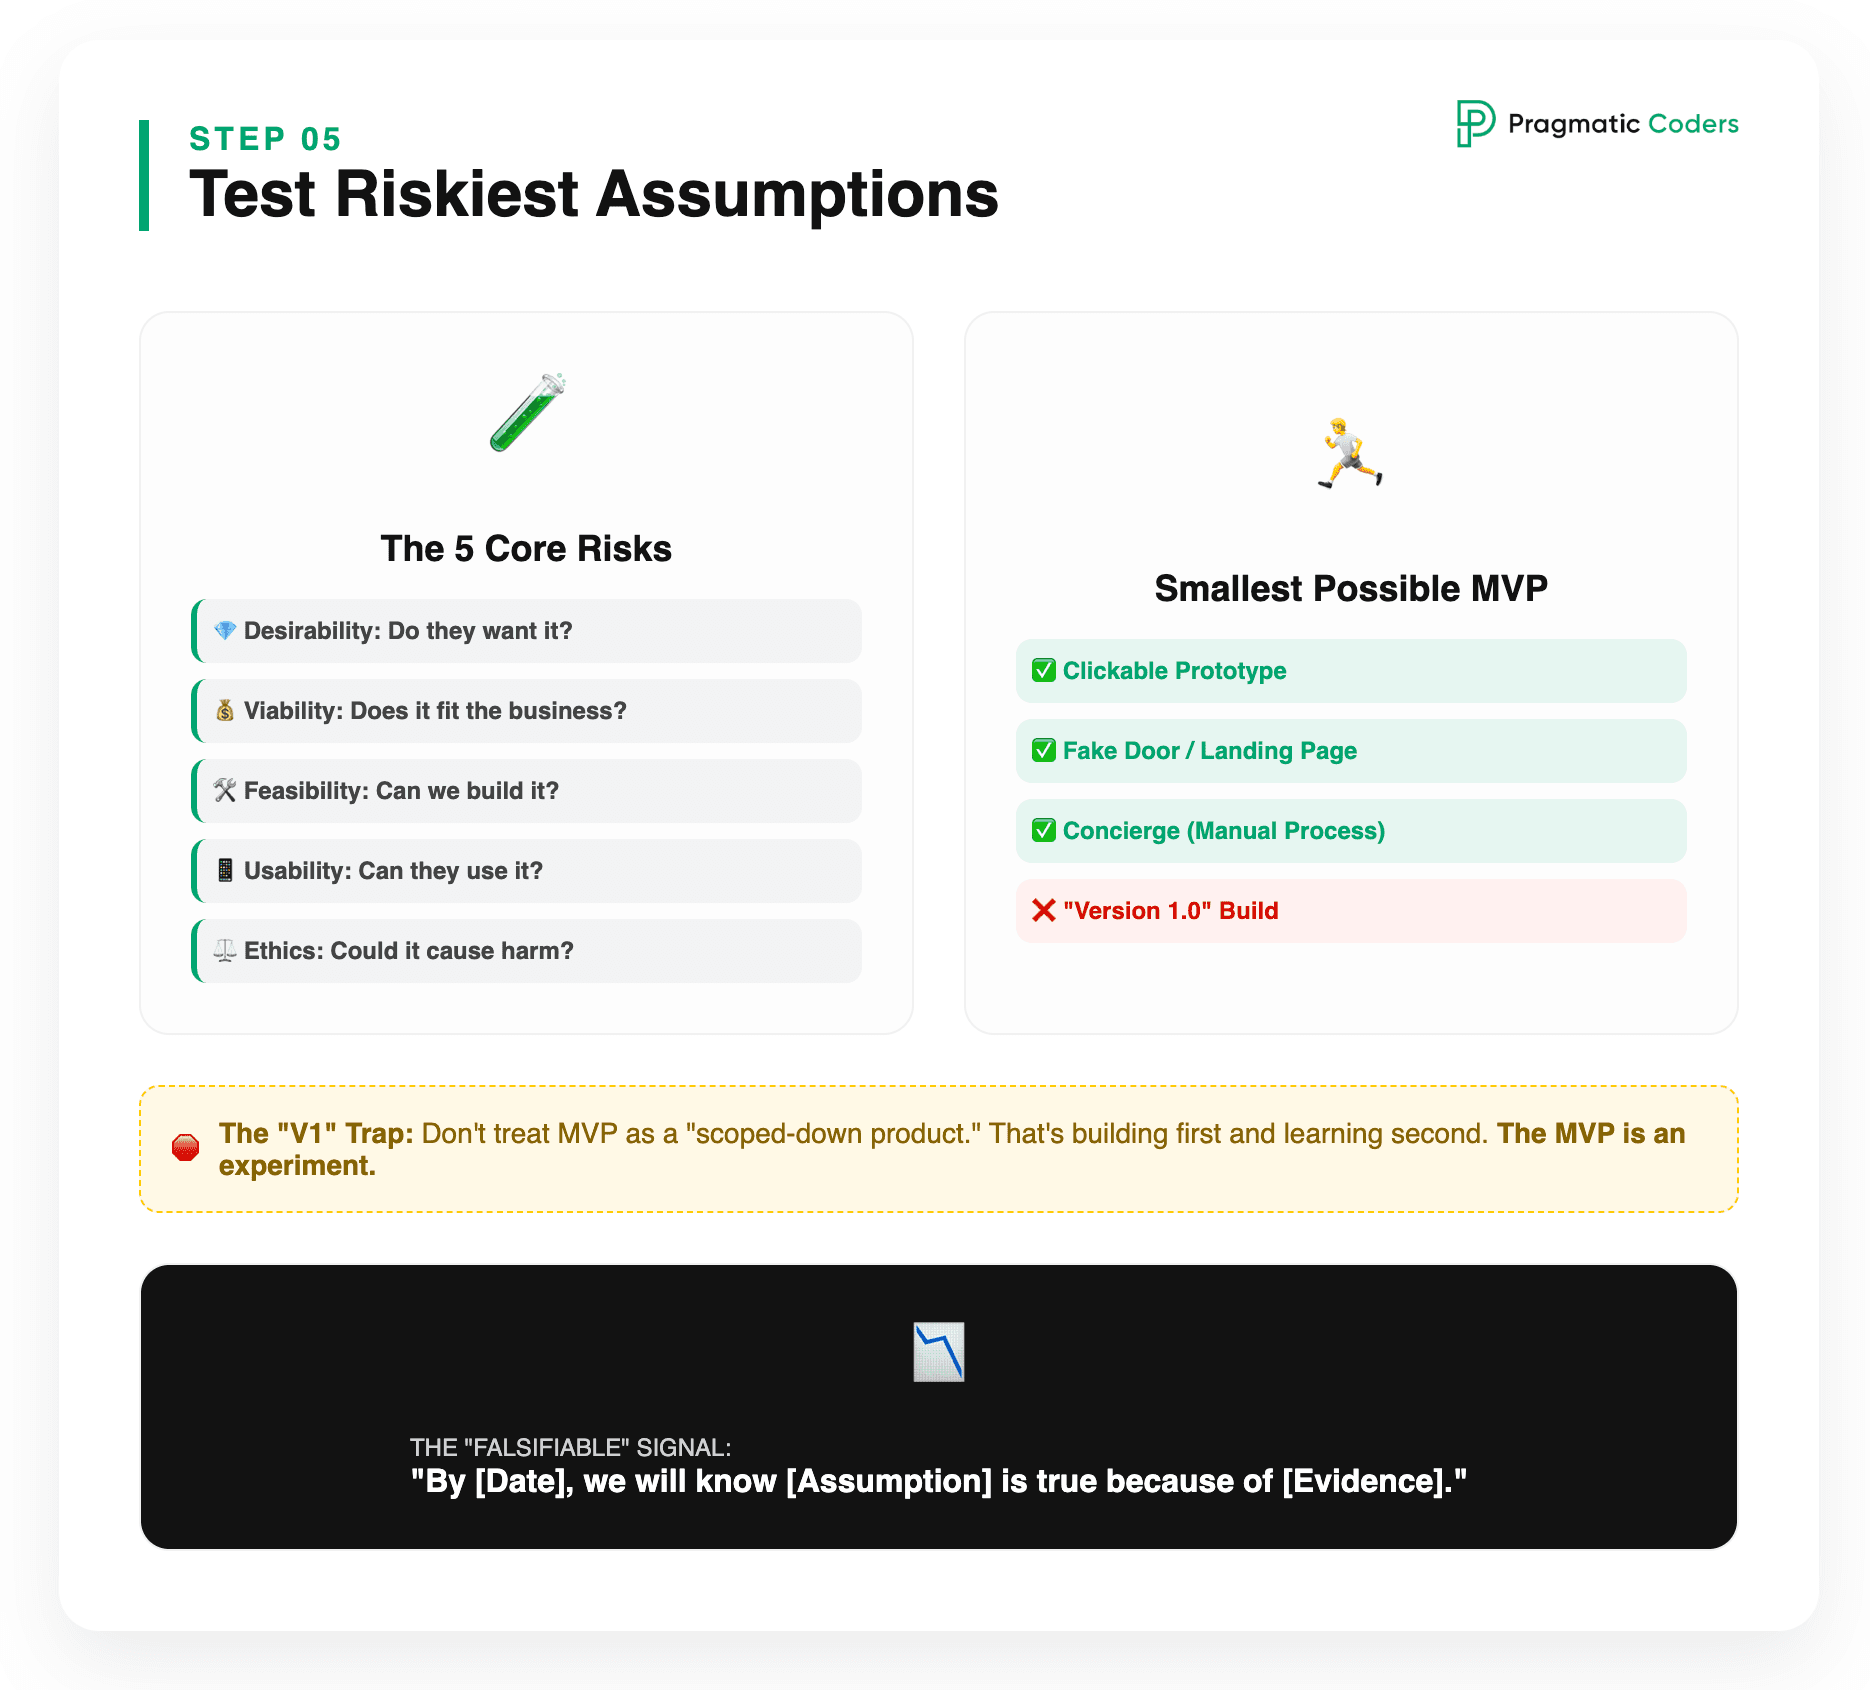
For every candidate solution on the Opportunity Solution Tree, list the assumptions it depends on. Five categories used by modern product discovery work – synthesizing Olsen’s product-market fit framing, Marty Cagan’s “four big risks”, and the recent push for explicit ethics review – are useful: desirability (will anyone want it), viability (does it work for the business), feasibility (can we build it), usability (can they use it), and ethics (could it cause harm).
Rank the assumptions by risk: how badly is the team hurt if the assumption is wrong? Pick the top one. Design the smallest possible test that would falsify it.
The MVP in this step is whatever lets you run that test cheaply. It might be a clickable prototype. It might be a fake door. It might be a manual concierge process where a human does what software will eventually do. It might be a landing page with a waitlist. The right MVP is the one that tells you the most about the riskiest assumption with the least investment.
Common mistake: treating “MVP” as a synonym for “scoped-down v1.” This guarantees you build first and learn second, which is the opposite of the point.
Signal you are done: you can complete this sentence – “By [date], we will know whether [assumption] is true, because [evidence we will collect].” If you cannot, the test is not designed yet.
Step 6 – Iterate from real behavior, not opinions
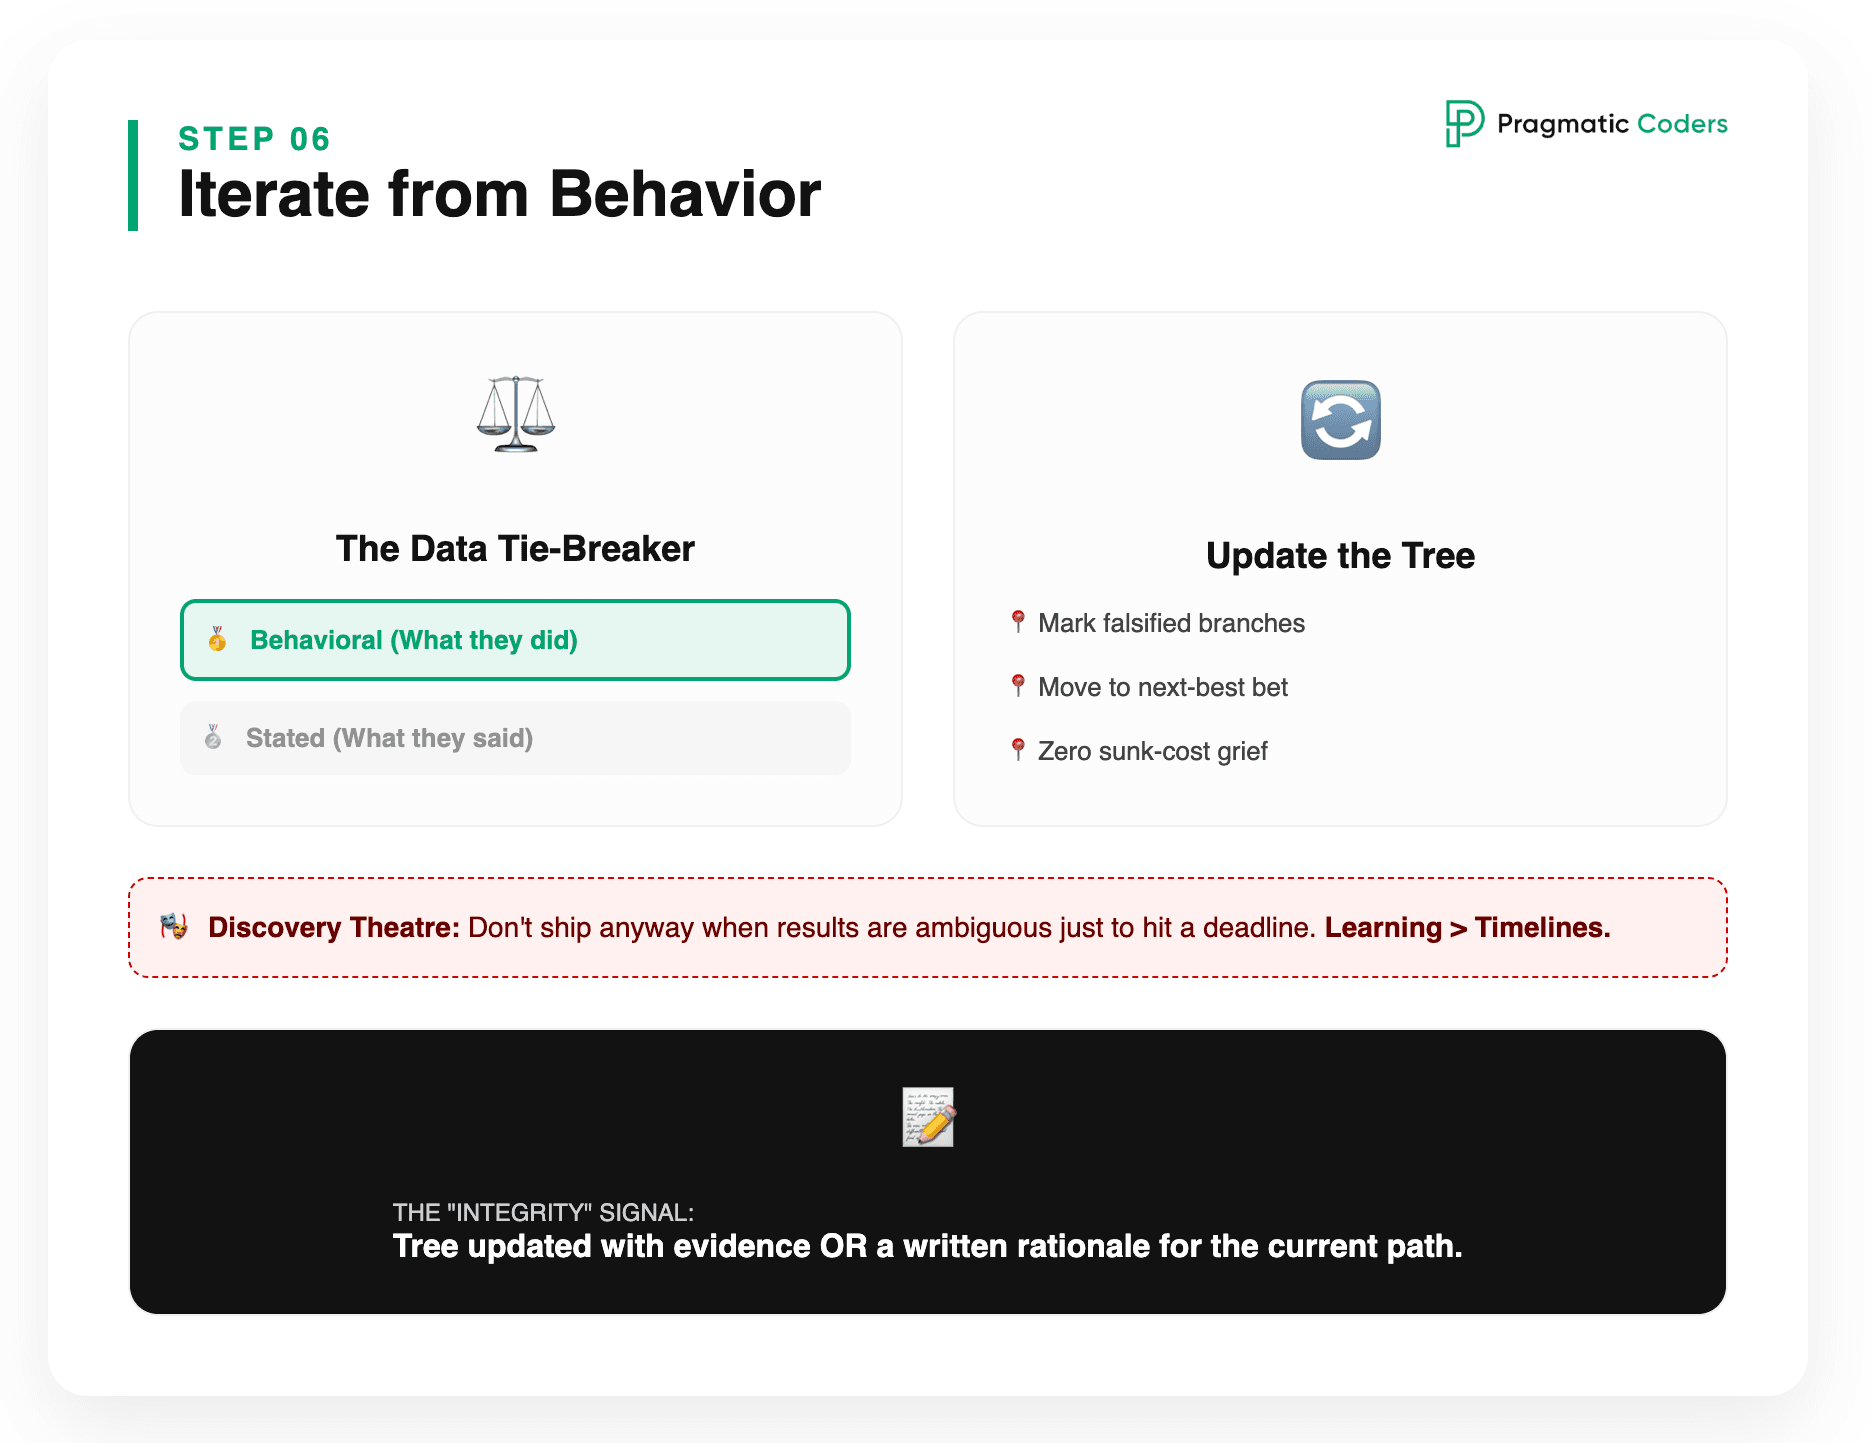
The MVP test produces data. Two kinds matter.
Stated data – what customers tell you in interviews and surveys after using the prototype. Useful, but always filtered through the Mom Test. People are kind. They speculate. They want to seem helpful.
Behavioral data – what they actually did. Did they finish the flow? Did they come back? Did they pay? Did they invite a colleague? Did they hit the wall and leave? This is the data that moves decisions.
When the two disagree, behavioral data wins. Always. People overestimate their future use of new things and underestimate the gravity of their current habits.
Use the result to update the opportunity tree, not to defend the original idea. If the assumption was wrong, the team’s job is to mark the branch as falsified and move to the next-most-promising one – without sunk-cost grief. This is the discipline that distinguishes teams that compound learning from teams that compound politics.
Common mistake: running the test, getting an ambiguous result, and shipping anyway because the timeline was already committed. This converts discovery into theatre.
Signal you are done: you have either updated the Opportunity Solution Tree with new evidence or made an explicit decision to keep the current bet, with a written rationale that names the evidence supporting that choice.
6. Anti-Patterns: How Customer-Centric Work Actually Fails in Practice
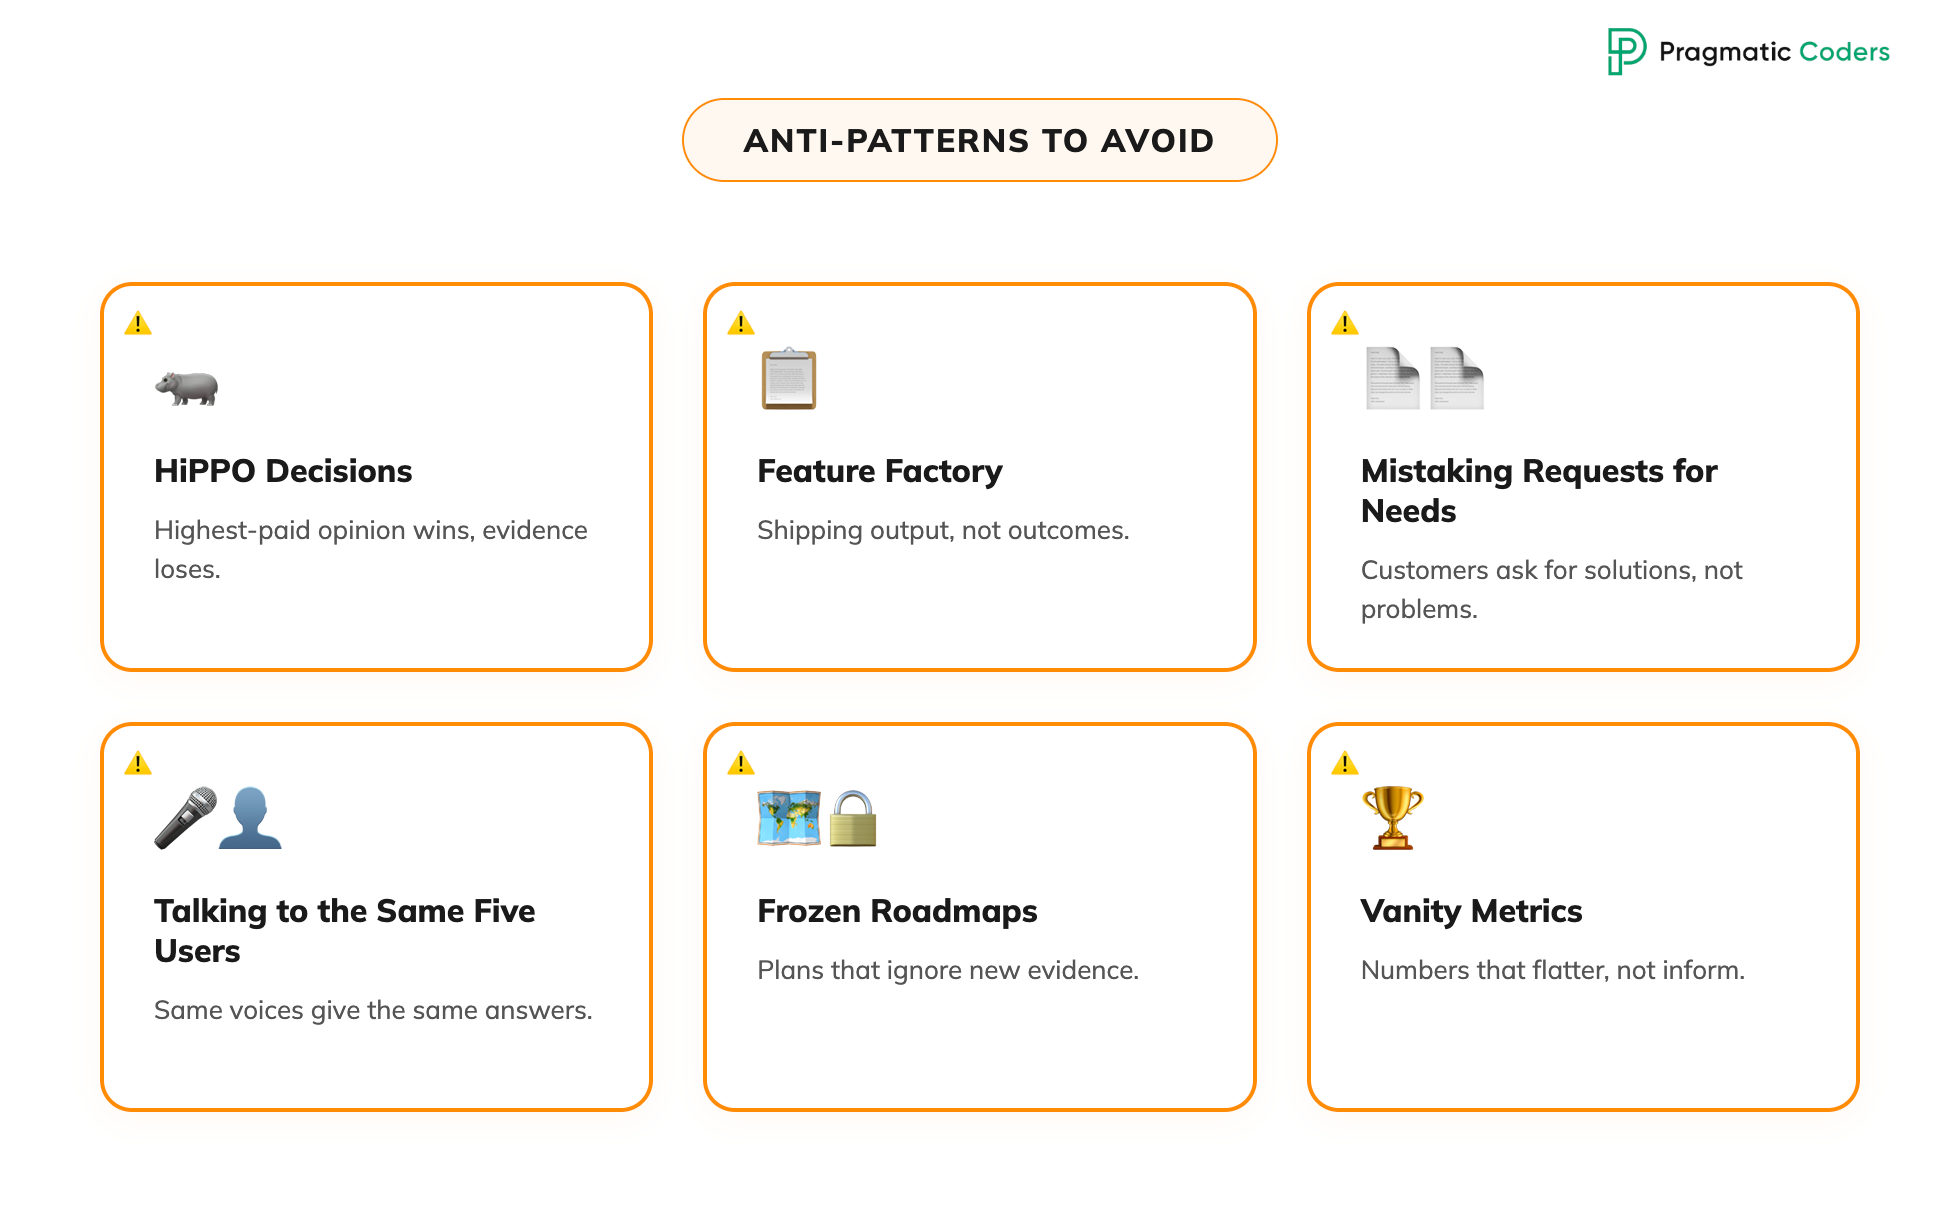
Teams rarely fail at customer-centric product development by ignoring it. They fail by doing a version of it that looks correct from the outside but produces no decision quality. The patterns below are the most common ways this happens. The first three (Wells Fargo, MTV, Flip Video) are well-known case studies used by Torres, Fitzpatrick and Olsen respectively. The remaining three are observations from working with product organizations – they are not in the books, but you will see them in your own org.
Pattern 1 – Outcome obsession without customer guardrails (Wells Fargo)
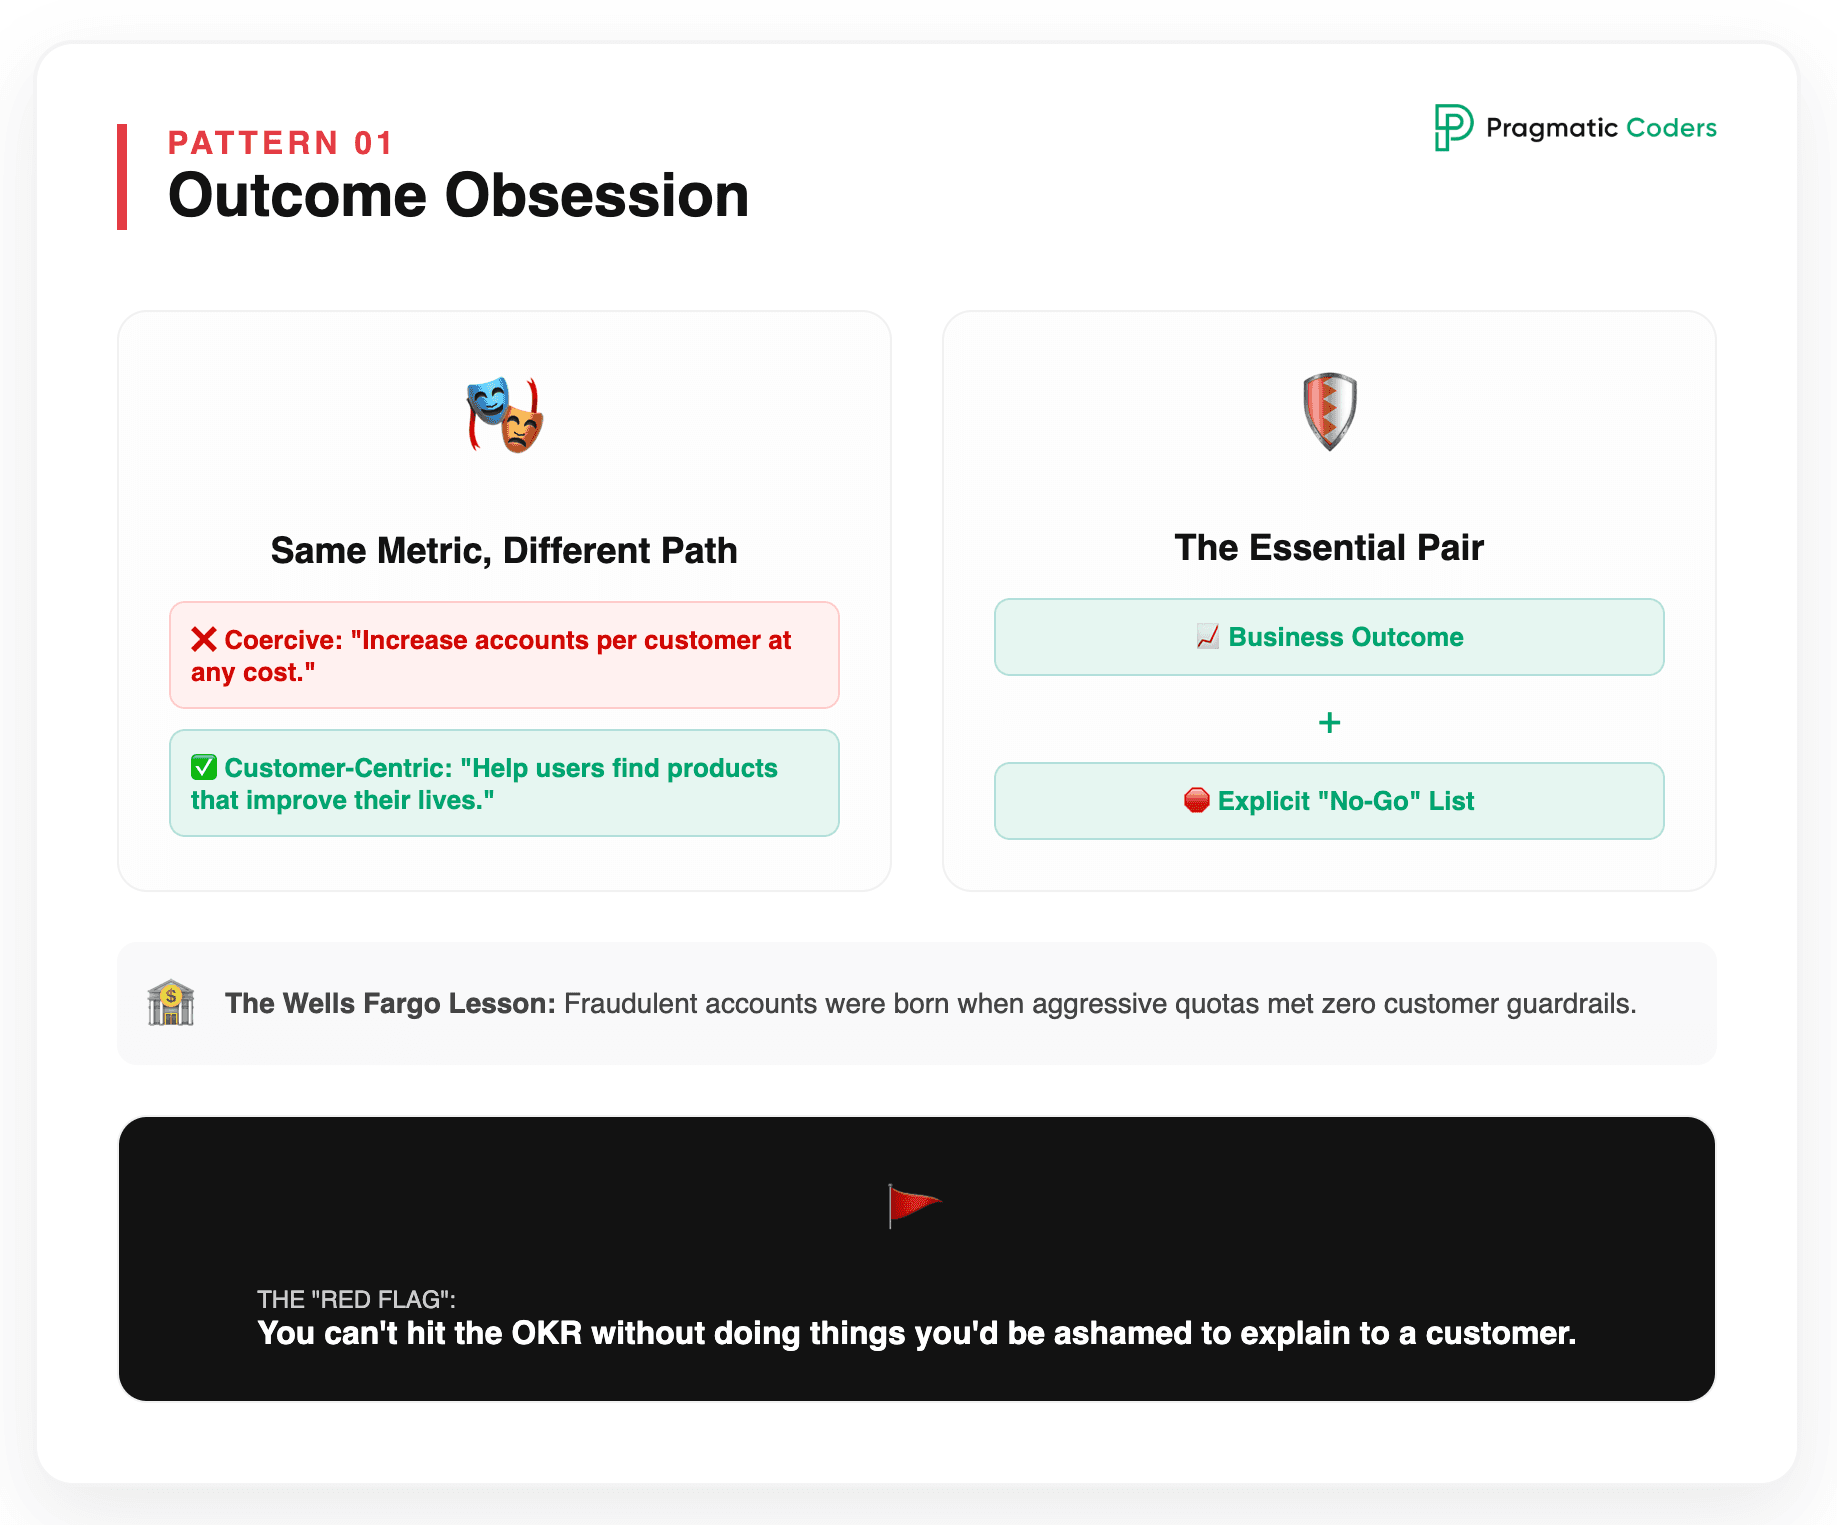
Between roughly 2002 and 2016, Wells Fargo pursued an outcome – increase the average number of accounts per customer – with extraordinary intensity. The strategy itself was rational; cross-selling is a real business lever. But the outcome was pursued without a corresponding customer-centric framing. The internal narrative became “more accounts at any cost.”
What followed is documented history. Frontline employees, under quotas they could not meet honestly, opened millions of fraudulent accounts. The bank paid $185 million in fines, lost billions in market value, and became a case study in operational risk programs.
Torres uses this story as the canonical example of why an outcome mindset alone is insufficient. The fix is not to abandon outcomes – those are essential – but to pair every outcome with an explicit customer-centric problem framing and an explicit no-go list. “Grow accounts at all costs” and “Help customers find more of our products that genuinely improve their financial life” point teams at very different solutions. The metric can be the same. The product cannot.
How to spot this in your org: an OKR that the team cannot achieve without doing things they would not want to explain to the customer.
Pattern 2 – Taking feature requests literally (Fitzpatrick’s MTV story)
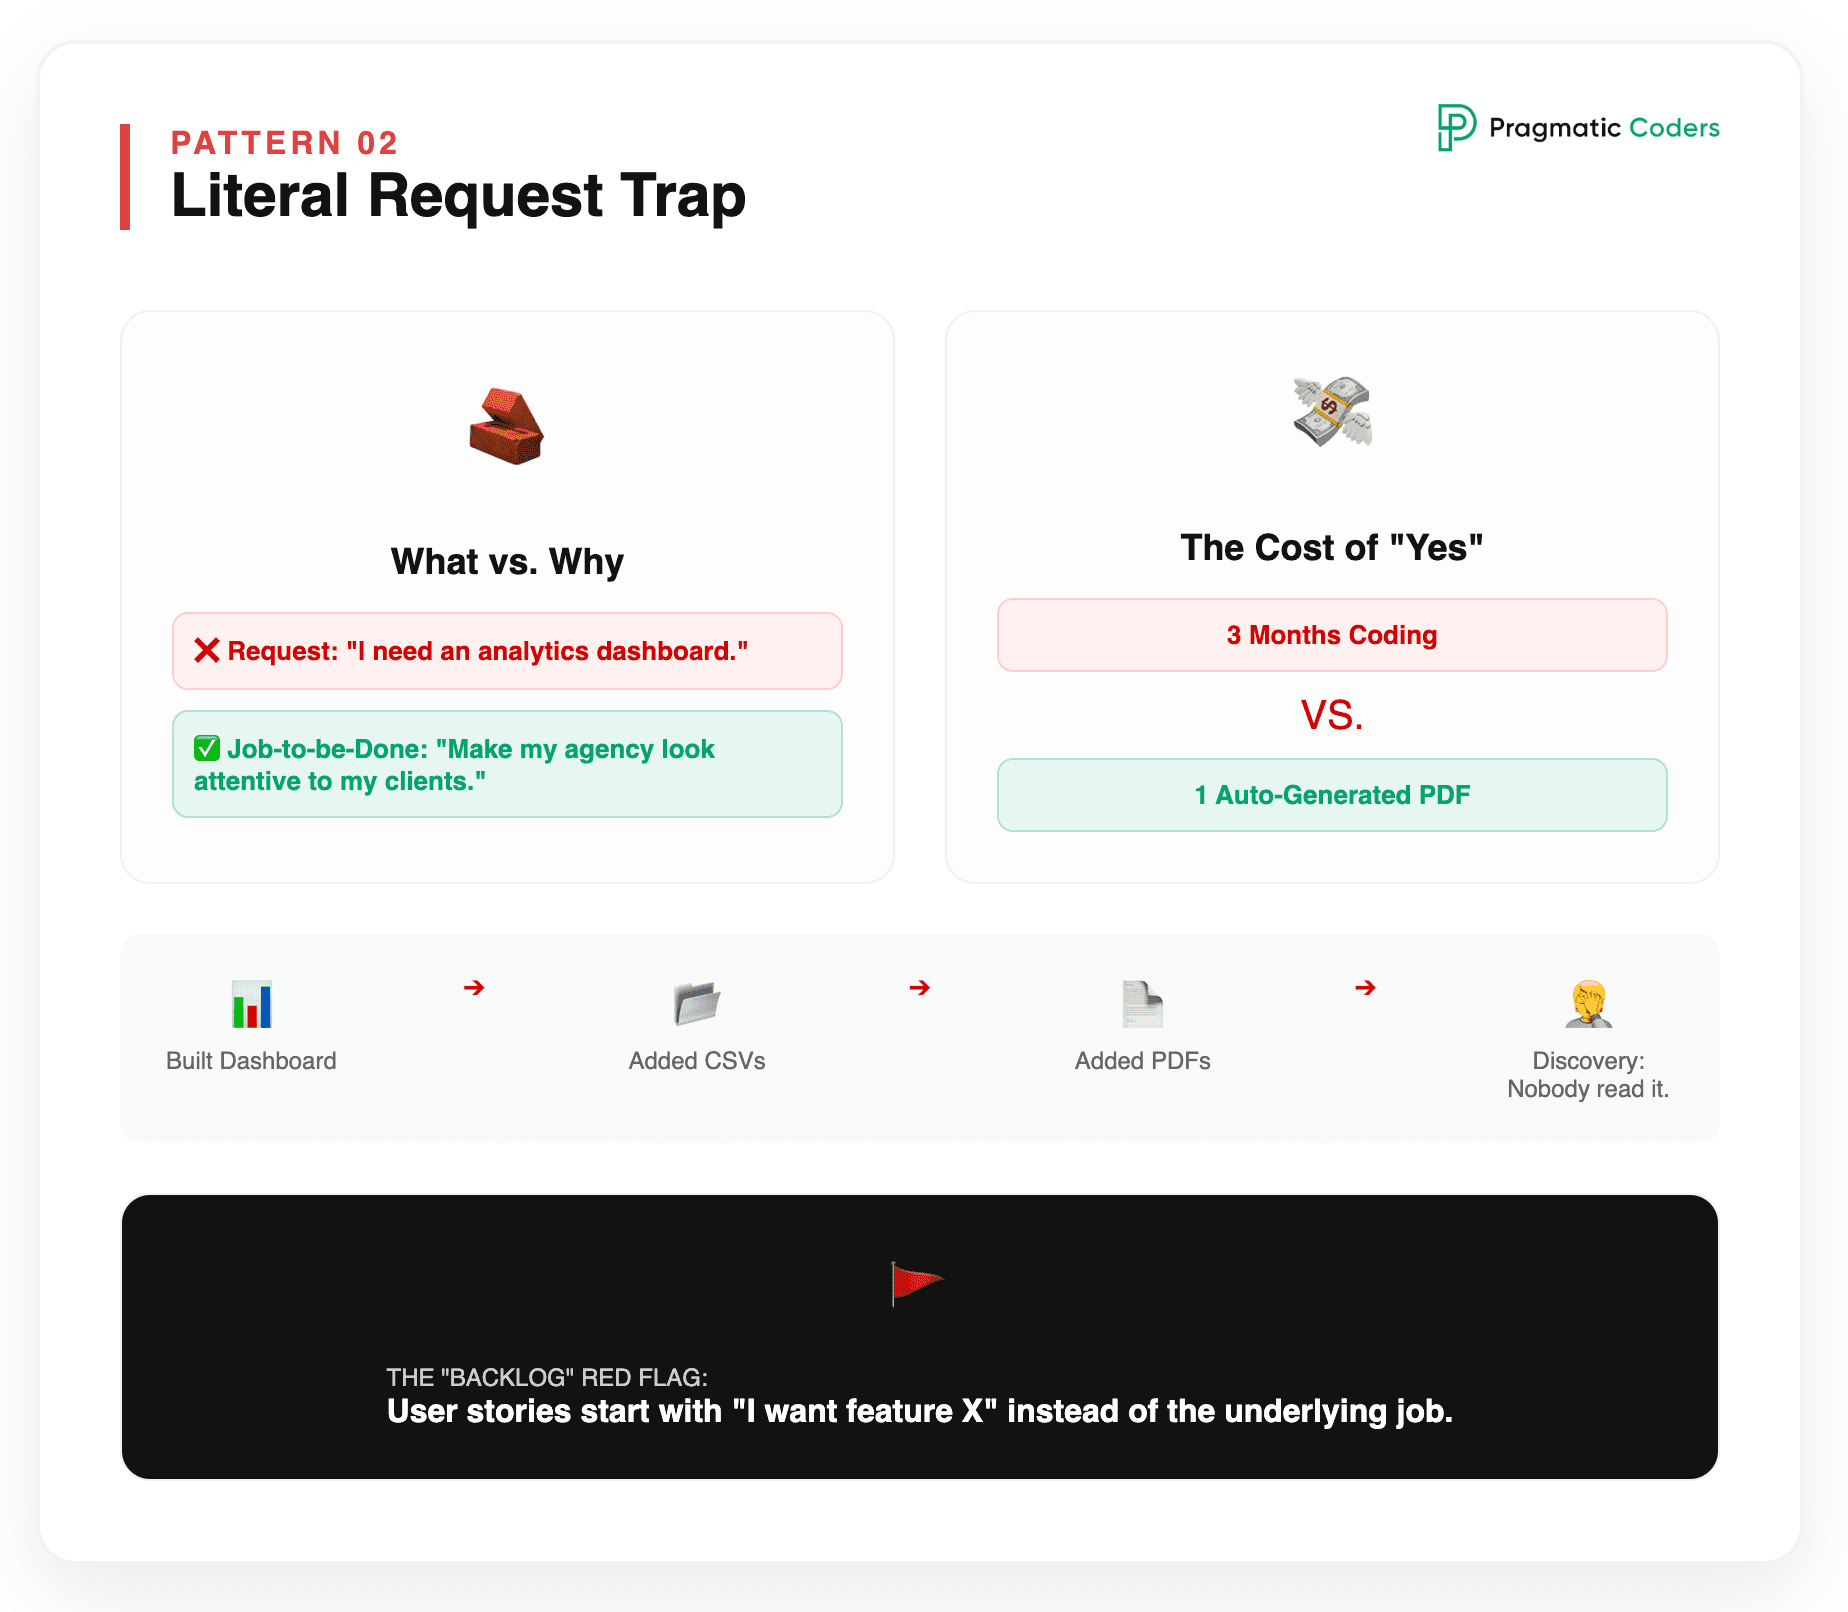
Fitzpatrick tells a formative story from his first company. An enterprise customer (MTV) requested an analytics dashboard. The team built it. The customer said it looked great. Then, every Friday, MTV called and asked Fitzpatrick to email them a CSV of the week’s data. The team added CSV export. MTV called back the next week. They added PDF export. MTV called again.
Eventually Fitzpatrick asked the customer-side contact why they kept calling instead of using the dashboard. The answer: nobody on her team actually read the data. They just needed to send something to their clients every Friday to demonstrate activity. The actual job-to-be-done was “make our agency look attentive to our clients on a weekly cadence.” The whole dashboard was the wrong solution; a single auto-generated PDF would have been right.
Three months of engineering work disappeared because nobody asked why behind the request.
How to spot this in your org: a backlog where the user stories begin with “As a user, I want feature X” – describing the requested feature rather than the underlying job.
Pattern 3 – Achieving fit, missing the next curve (Flip Video)
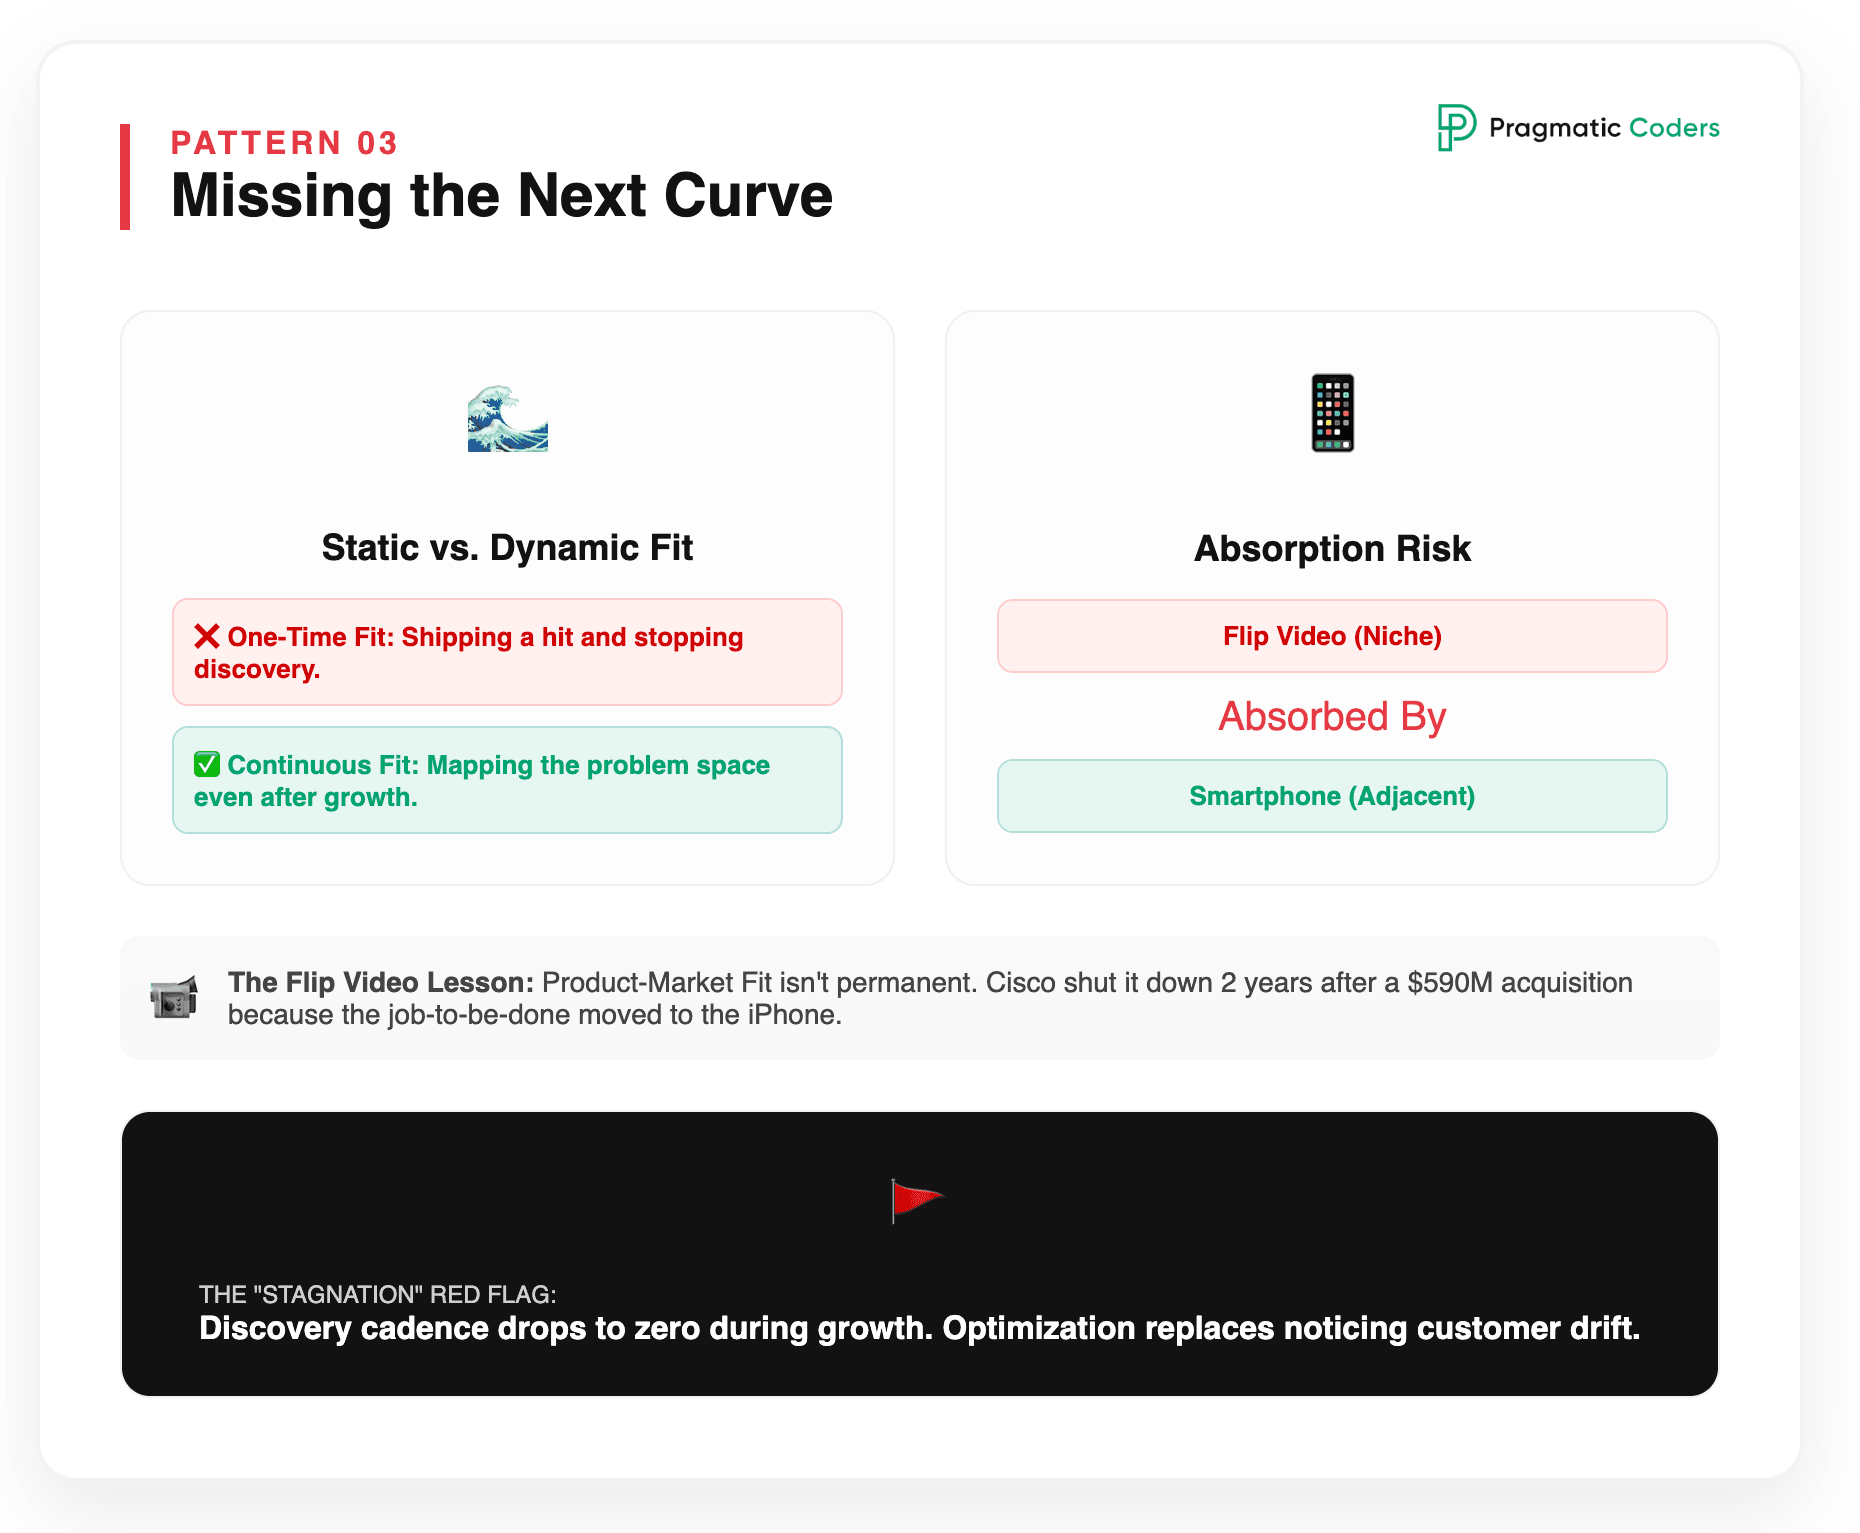
The Flip Video Camera, launched in 2006 by Pure Digital, was textbook product-market fit. It was simpler, cheaper, and more pocketable than traditional camcorders. Cisco acquired the company for $590 million in 2009.
Two years later, Cisco shut the product down. Not because the customer-centric work had been wrong – it had been excellent – but because the customer’s underlying need had moved. The iPhone 3GS shipped with built-in video in 2009; by 2011, smartphones had absorbed the entire problem space the Flip was built around.
Olsen uses the example to make a specific point: customer-centricity is not a one-time exercise that earns you a permanent product-market fit. The customer’s context evolves. New technologies redefine what “good enough” means. Adjacent solutions absorb the job-to-be-done. Customer-centric teams keep mapping the problem space after they have shipped, not just before.
How to spot this in your org: the discovery cadence quietly drops to zero once the product reaches its growth phase. The team becomes optimization-focused and stops noticing when customer behavior begins drifting.
Pattern 4 – Building for the vocal minority
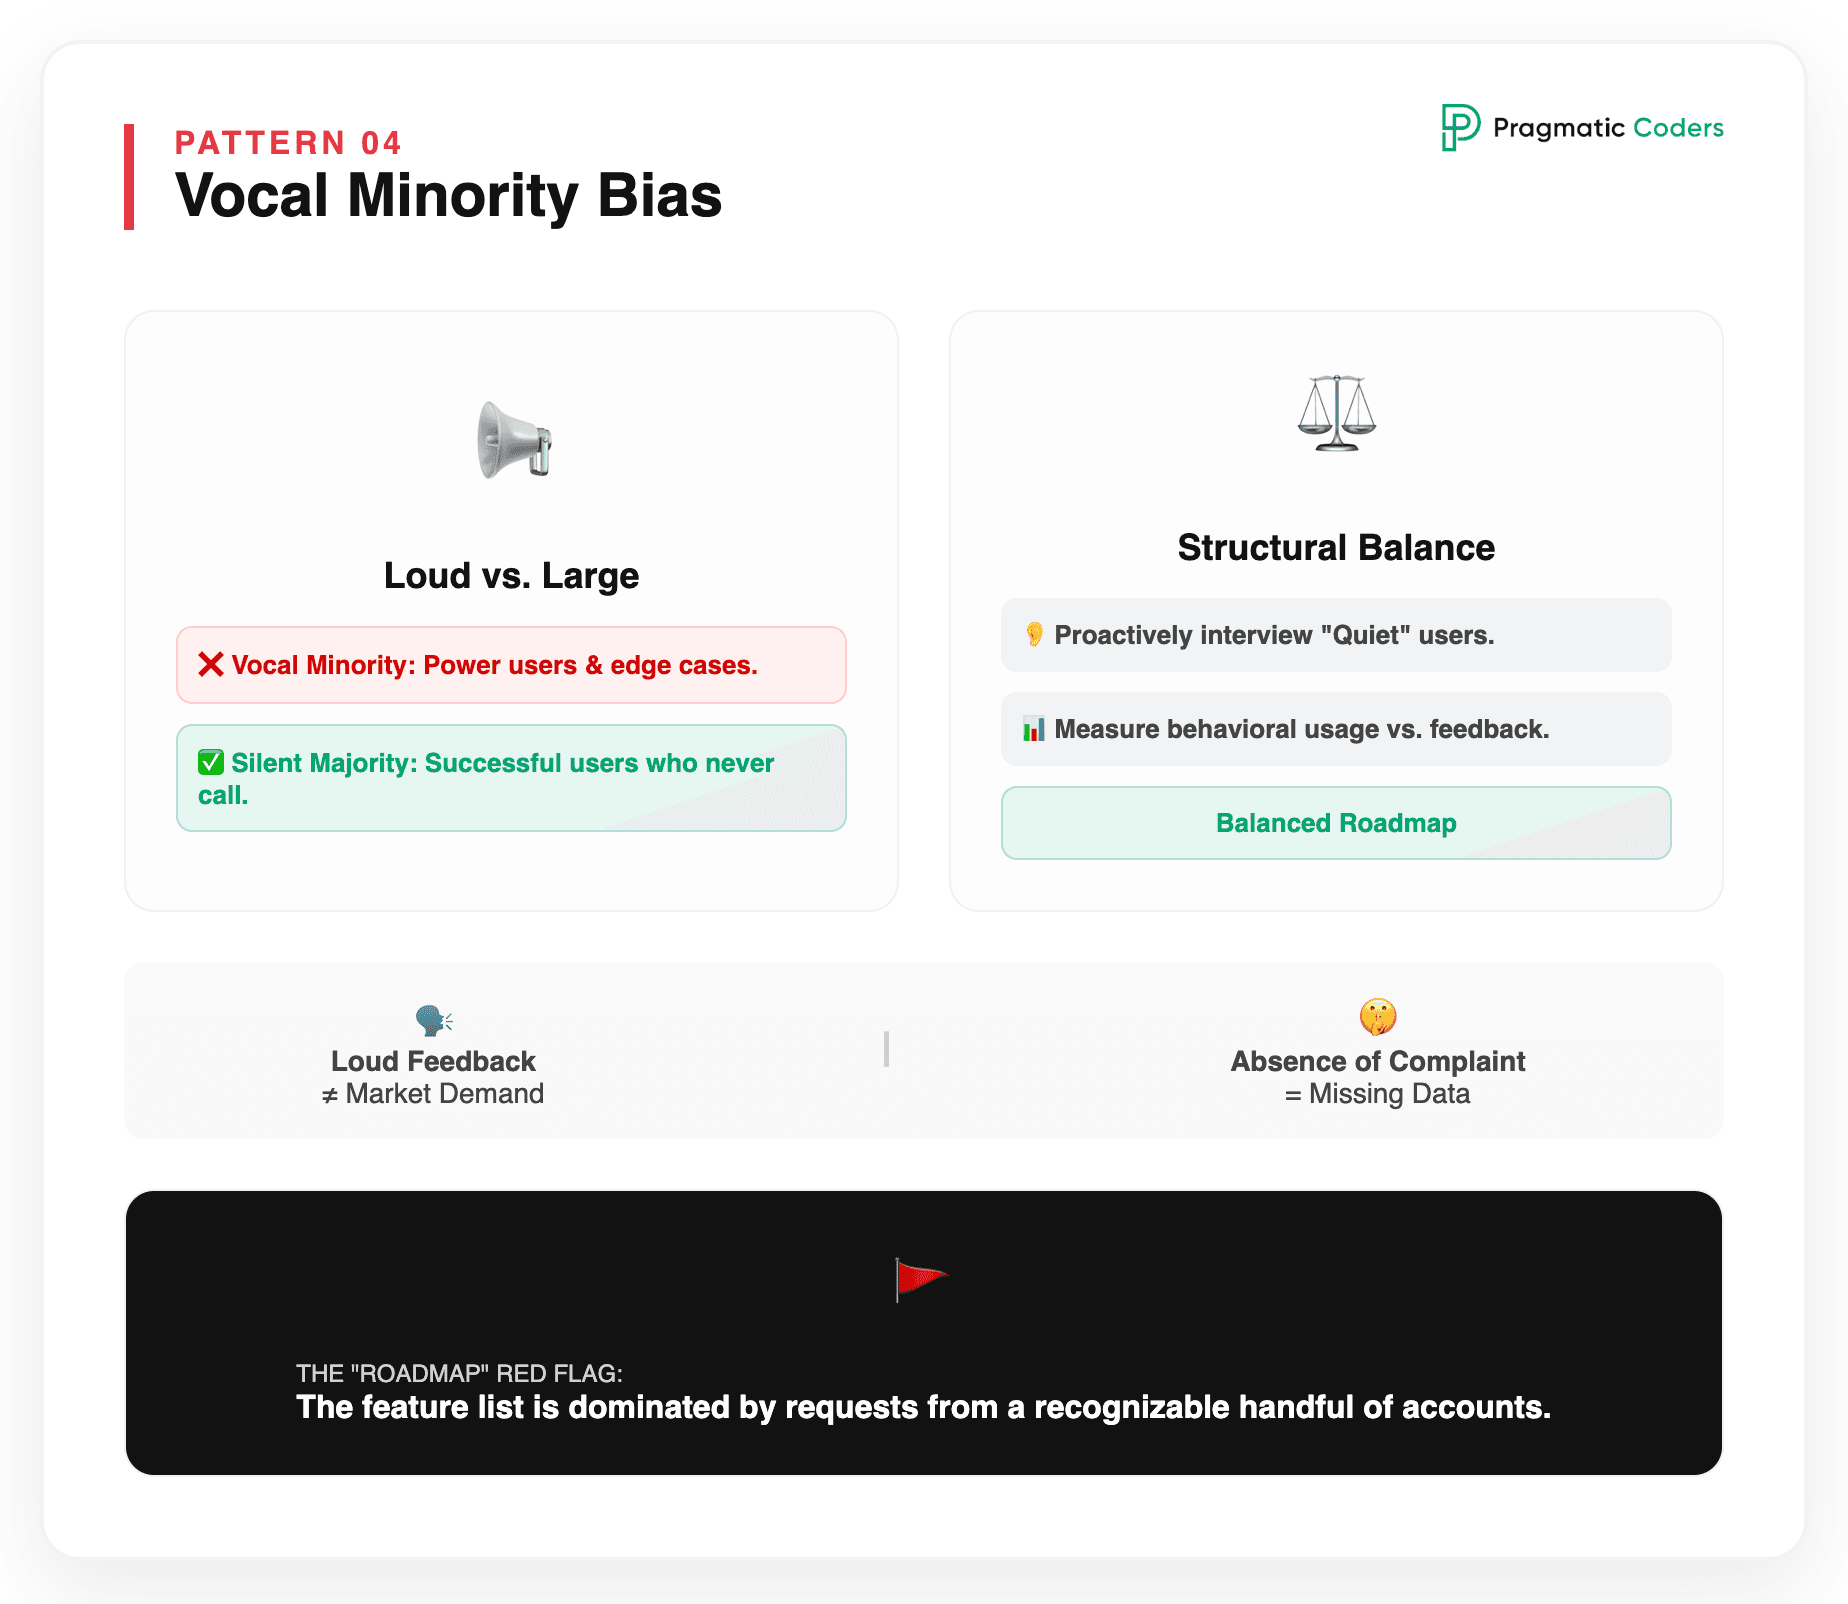
Power users, early adopters, and customers with unusual edge cases generate disproportionately loud feedback. Teams that listen to the loudest voices end up optimizing for a small fraction of the user base at the expense of the majority – typically the silent, successful users who never contact support and never request features.
The fix is structural, not personal. Periodically schedule conversations with customers who use the product successfully and never write in. Their absence of complaints is not satisfaction; it is information you have not yet collected.
How to spot this in your org: the roadmap is dominated by requests from a recognizable handful of accounts.
Pattern 5 – Research theatre
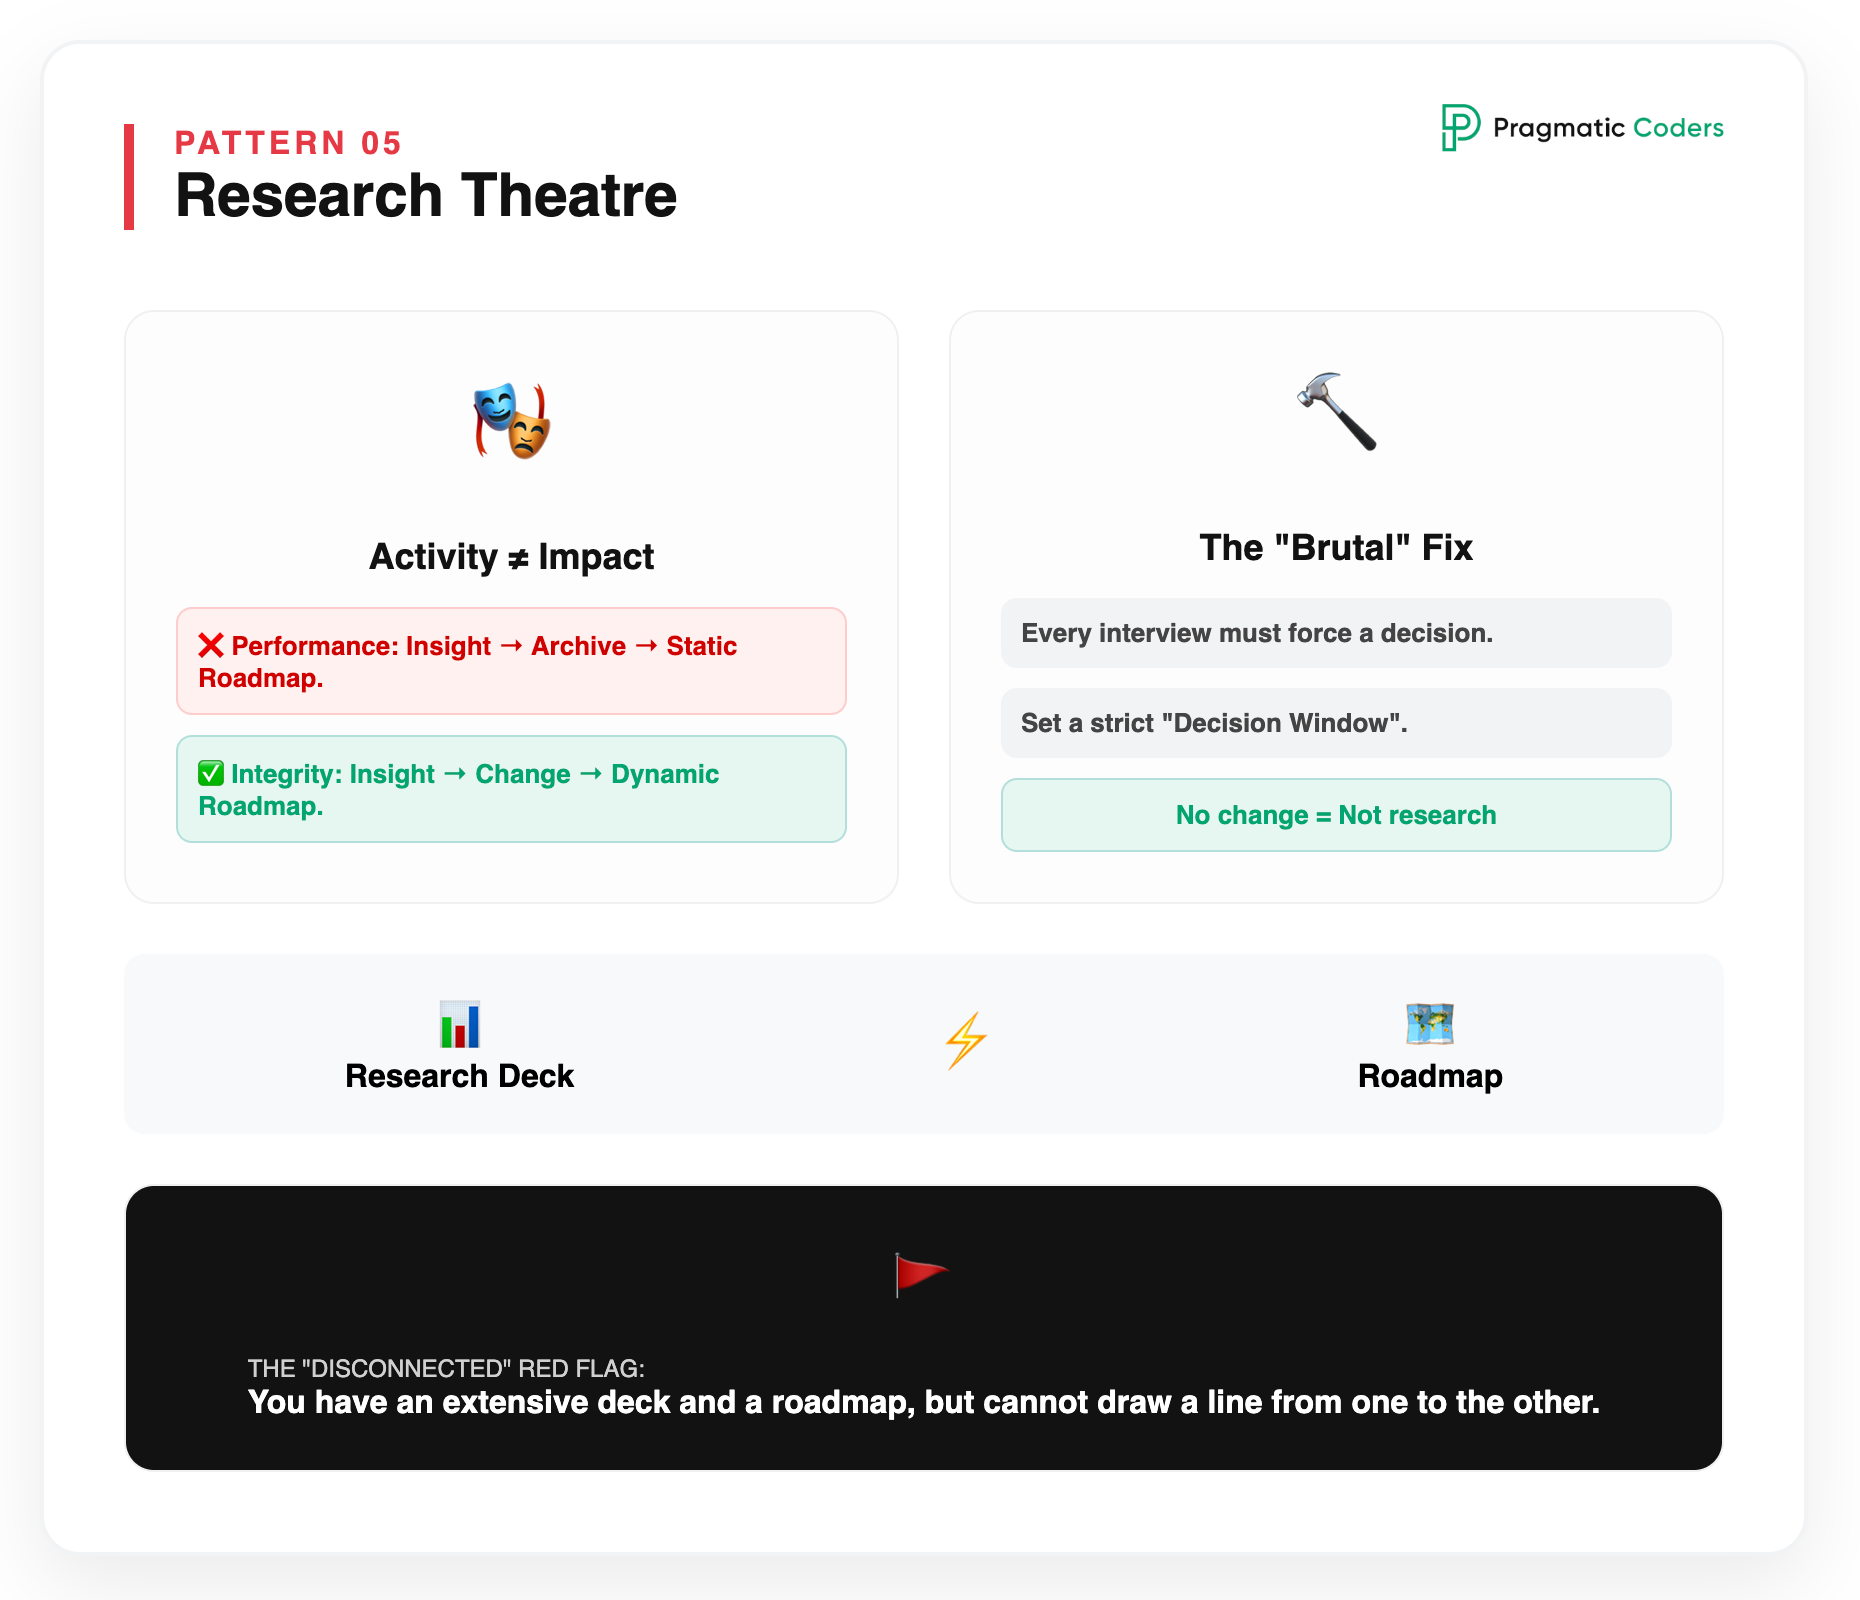
The most insidious failure mode. The team runs interviews. Generates personas. Maintains a research repository. Hosts share-outs. And the roadmap looks the same as it would have without any of it.
Research theatre happens when learning activity is decoupled from decision authority. Insights are produced and filed. Decisions are made elsewhere, on other criteria, by other people. The customer-centric program becomes a content marketing function for the research team.
The fix is brutal but simple: every interview, every test, every research artifact must terminate in a specific roadmap decision within a defined window. If a body of research closes a quarter without changing anything in the backlog, it is not research. It is performance.
How to spot this in your org: you can produce an extensive research deck and a current roadmap, and nobody on the team can draw a line from one to the other.
Pattern 6 – Confusing customer-centric with customer-led
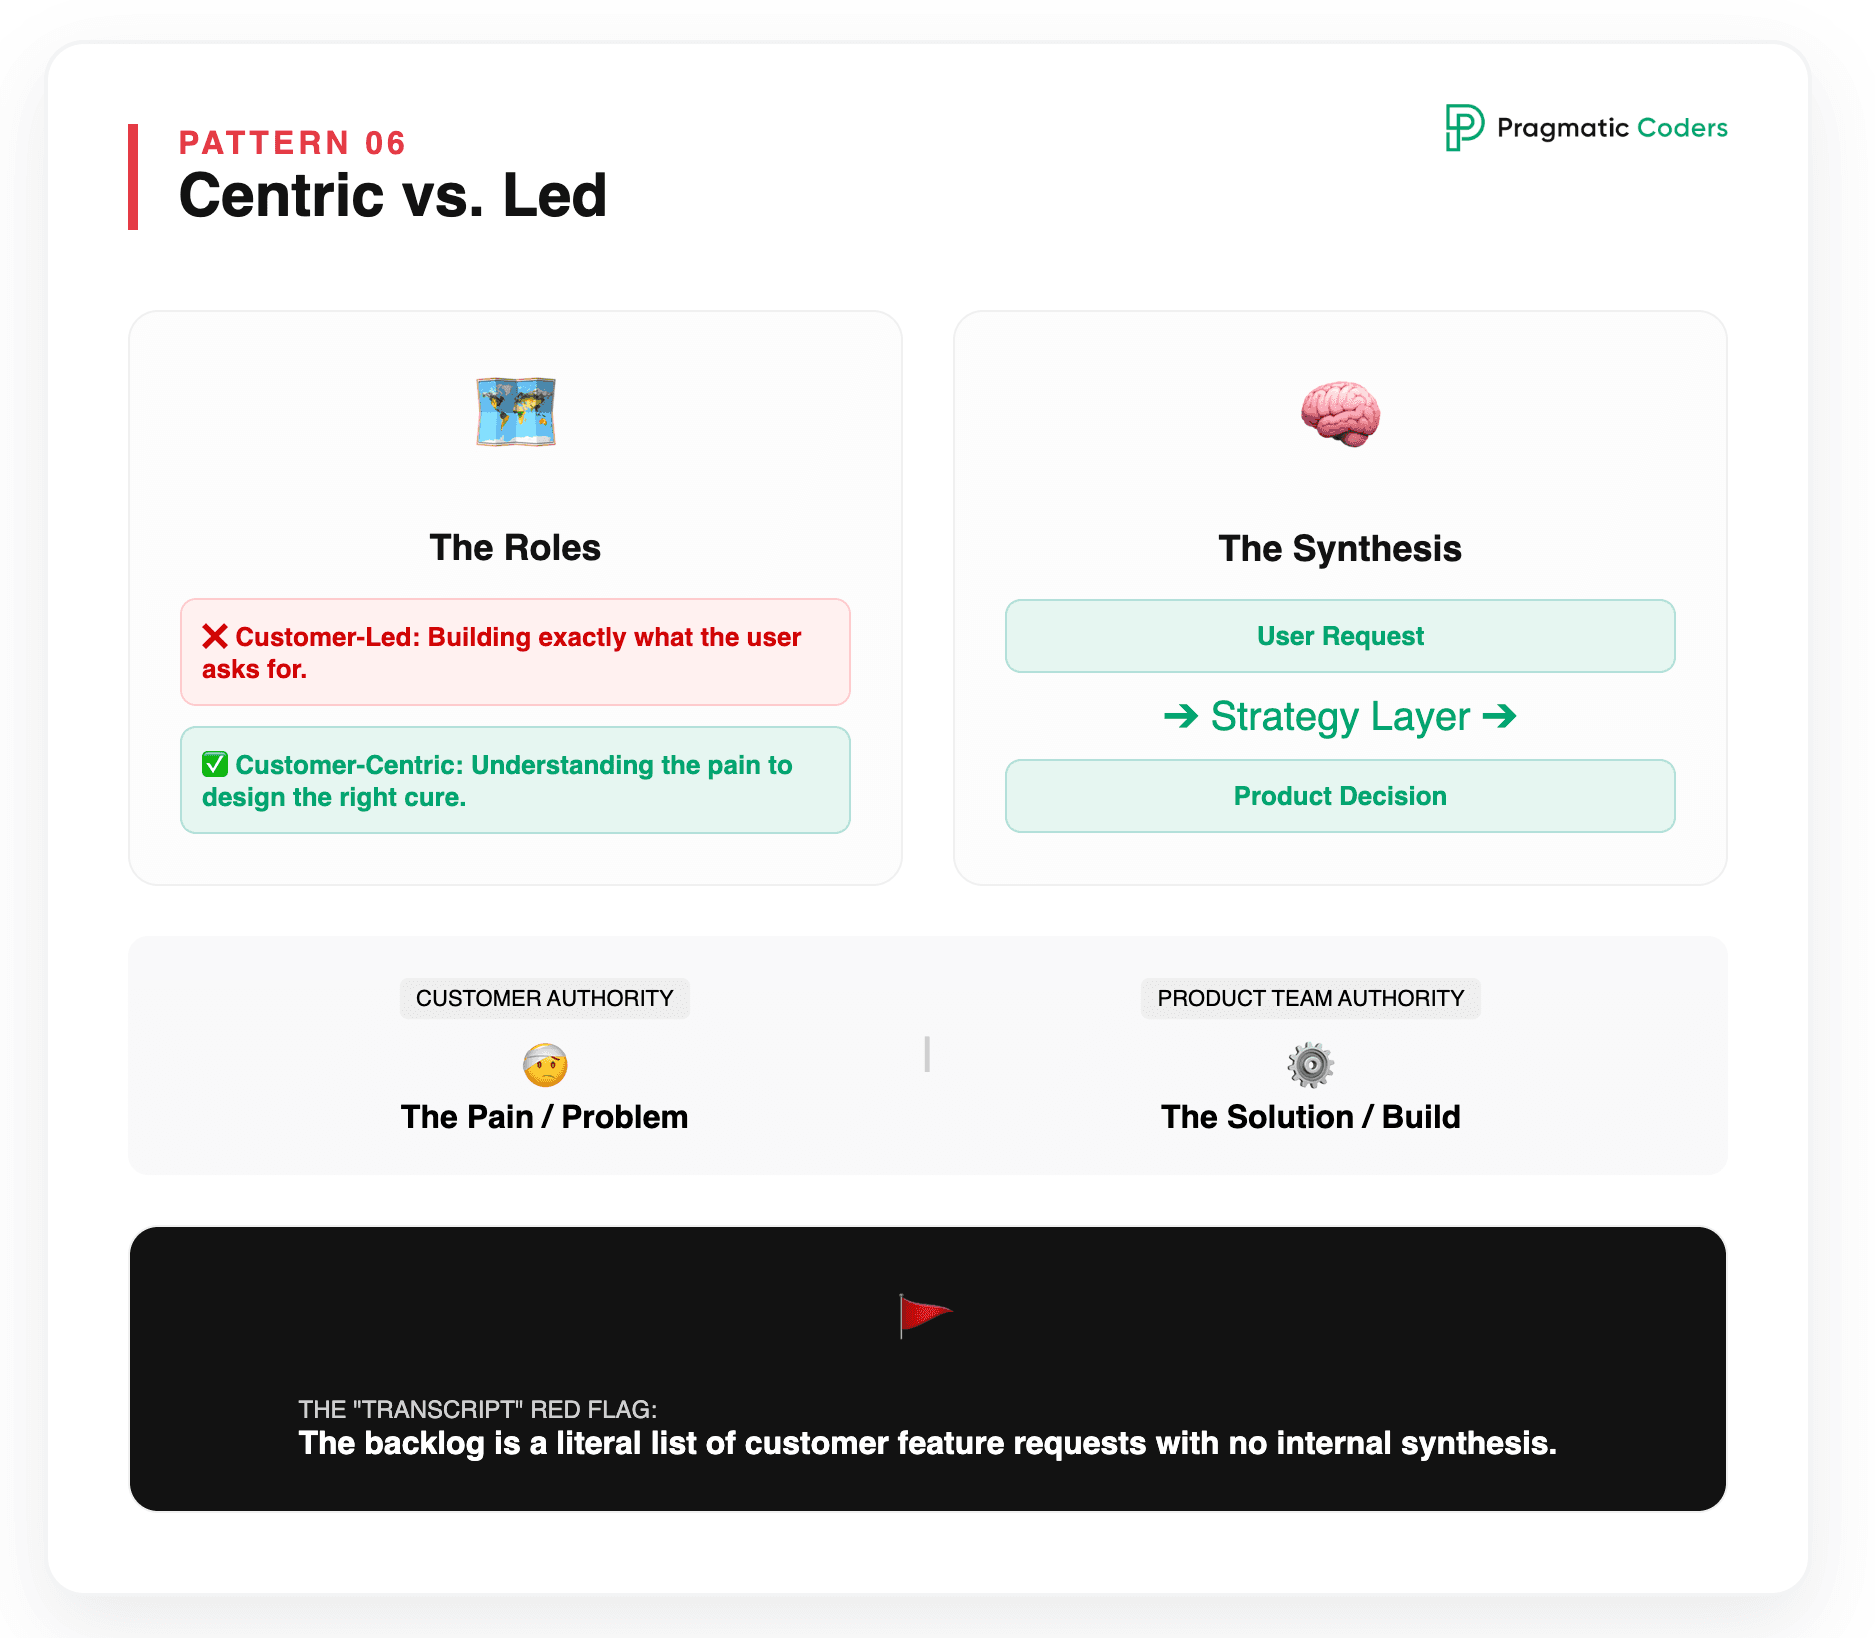
Customer-centric does not mean building everything the customer asks for. The job of a customer-centric team is to deeply understand the customer’s problem and apply judgment, expertise, and strategy to choose a solution. Sometimes that solution is not the one the customer requested.
Henry Ford’s “faster horses” line is misleading because it gets used to justify ignoring customers entirely. The real lesson is more subtle: listen to customer problems, not customer solutions. The customer is the authority on their own pain. The team is the authority on what to build in response.
How to spot this in your org: the backlog is a literal transcript of customer requests, with no synthesis layer in between.
7. Customer-Centric Metrics (And the Warning Metrics That Protect You)
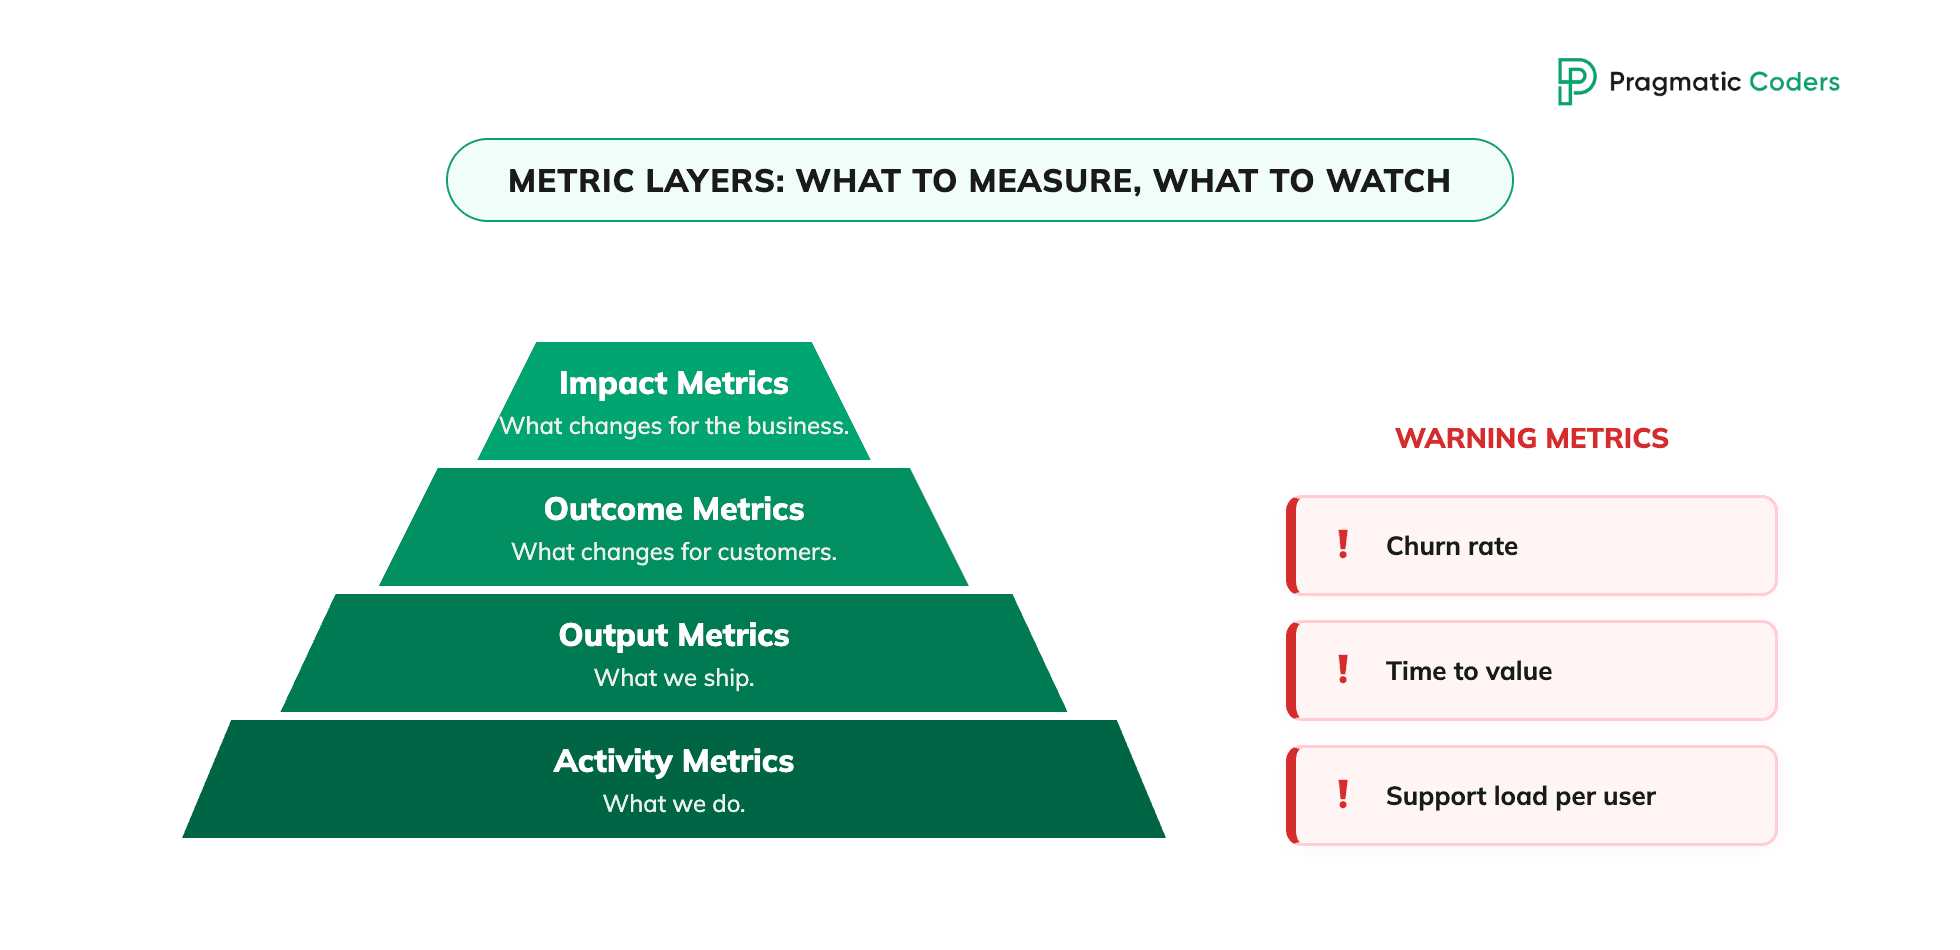
A customer-centric process produces customer-centric decisions only if it is measured by customer-centric metrics. Most teams default to feature-centric metrics – adoption, click-through, screens viewed – and then wonder why their customer satisfaction does not move.
Outcome metrics, not output metrics
The first split is between what we shipped and what changed for the customer. Output metrics are operational; they tell you the team is busy. Outcome metrics are strategic; they tell you the work mattered.
Concrete contrast:
- Output: “We shipped the new bulk-edit feature.”
- Customer outcome: “Average time to update 100 records dropped from 18 minutes to 2 minutes.”
- Business outcome: “Power-user retention at 90 days improved from 62% to 71%.”
A customer-centric team reports outcomes alongside outputs in every review. The output is the work. The outcome is the point.
The four metric layers
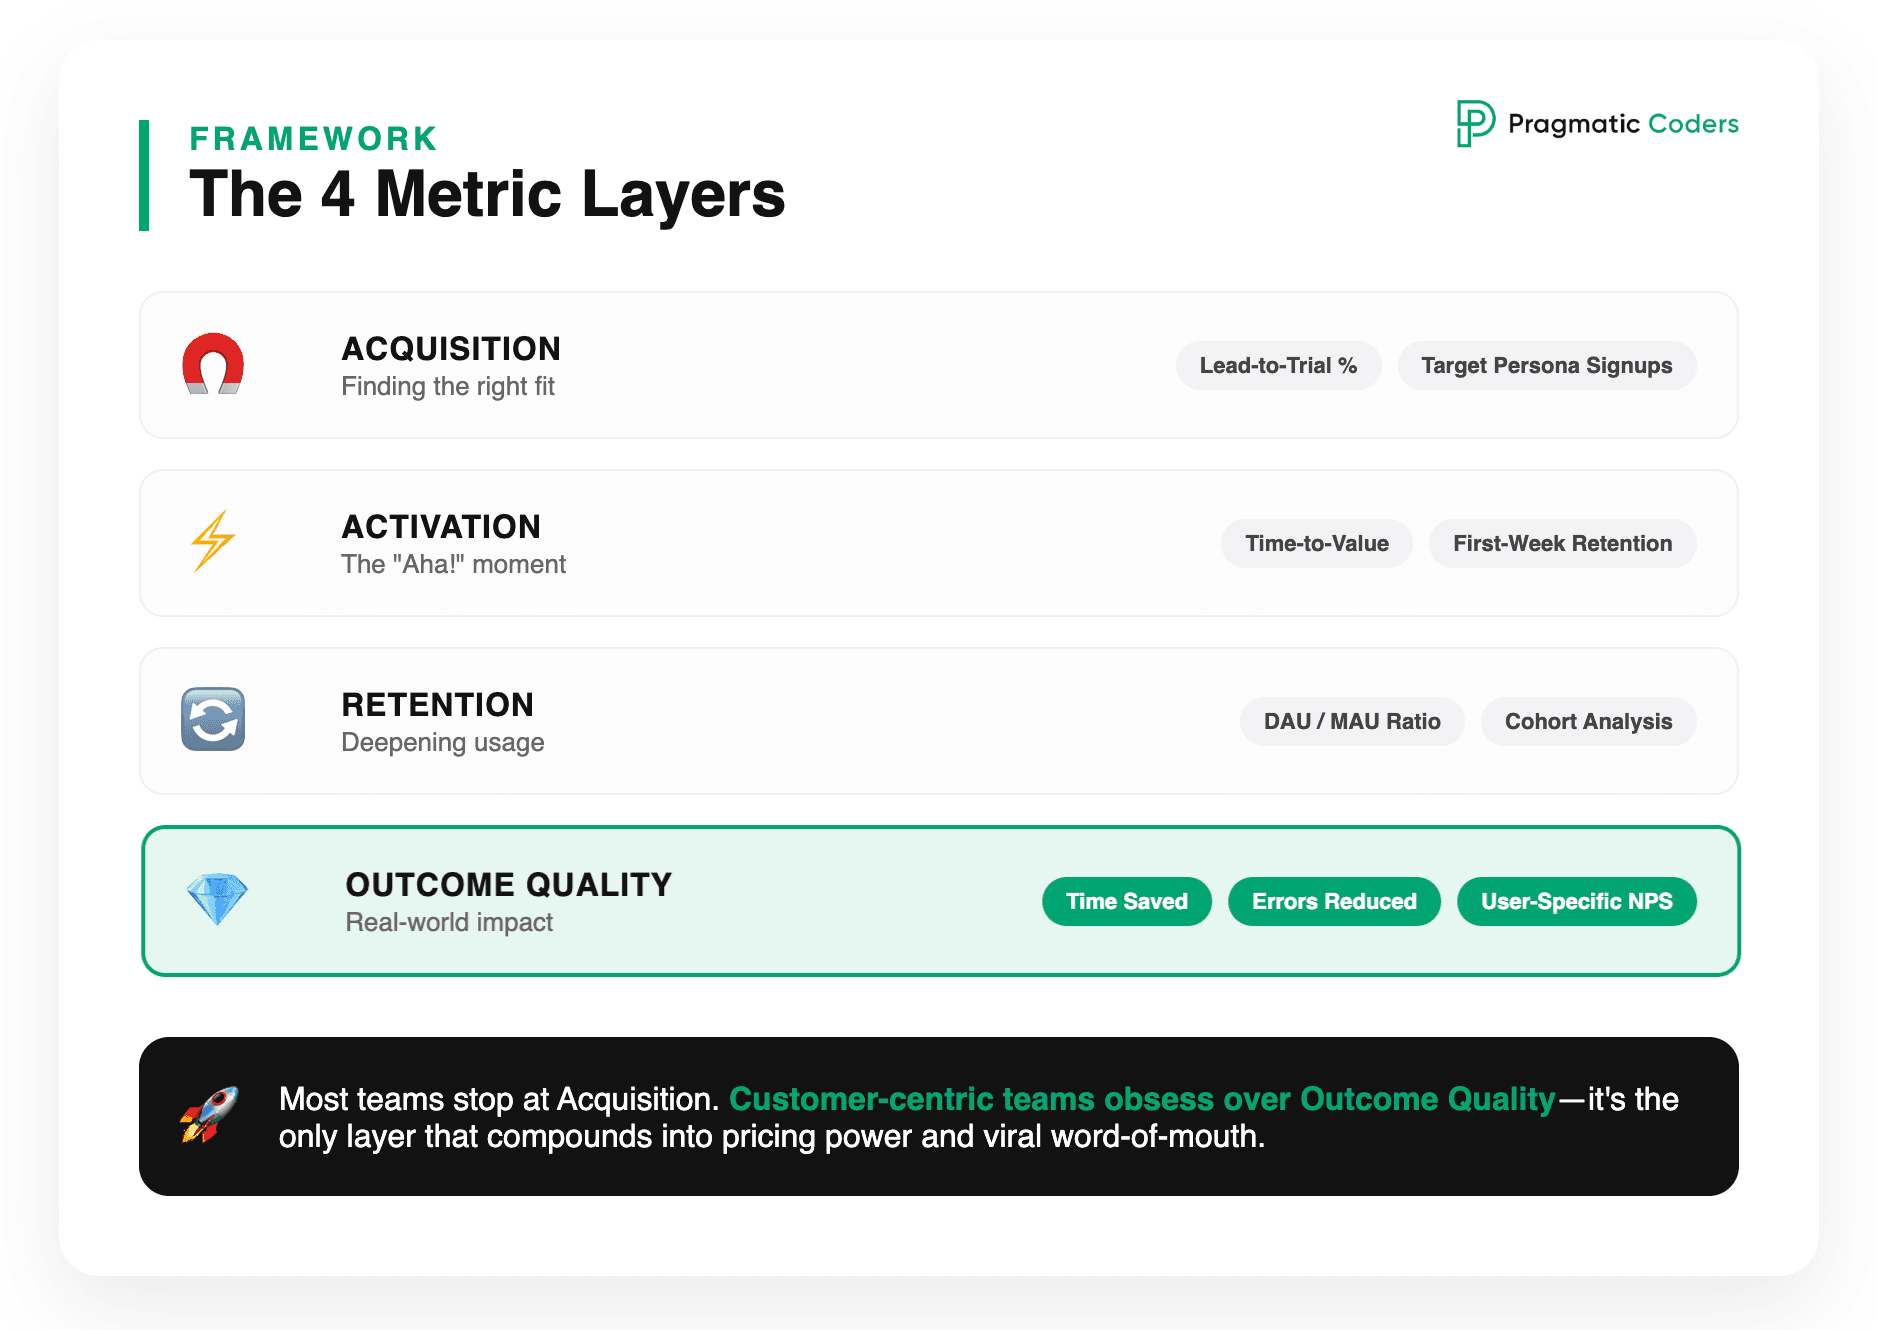
A useful customer-centric metric framework – building on Dave McClure’s Pirate Metrics (AARRR) and the product-metric work in Olsen’s Lean Product Playbook, with the final layer reframed for customer-side value rather than revenue alone – operates at four levels at once:
Acquisition – are the right customers finding the product? Examples: qualified-lead-to-trial conversion, traffic from intended segments, signup completion in target persona.
Activation – are they reaching the first meaningful value? Examples: time-to-first-value, percent of new users completing the activation event, first-week retention.
Retention and engagement – are they coming back and getting deeper value? Examples: ratios such as daily/weekly/monthly active users (DAU/WAU/MAU), cohort-based retention analysis across user groups, and measuring increased frequency or diversity of use among core features.
Outcome quality – did the product genuinely improve the customer’s situation? Examples: time saved, errors reduced, jobs completed, revenue generated for the customer, NPS from customers who actually use the product (not all customers).
Most teams obsess over level 1 and 2 because they are easiest to instrument. Customer-centric teams pay disproportionate attention to level 4, because that is the level that compounds into long-term retention, word-of-mouth, and pricing power.
Warning metrics that protect you from gaming the wrong number
Optimizing a single metric in isolation will inevitably distort your product decisions over time. This dynamic is captured by Goodhart’s Law: once a measure becomes a target, it ceases to be a reliable measure. The best-practice countermeasure–adopted in leading A/B testing programs at companies like Microsoft, Booking.com, Airbnb, and Spotify–is to always “pair” each primary metric with a “warning metric” (sometimes called a guardrail metric). Here, to “pair” means that for every main metric you’re aiming to improve, you also monitor a secondary metric that acts as a safeguard. This second metric helps you spot any unintended negative consequences that might arise as you optimize for the primary metric.
The pairings below are not from the three books in Section 3; they are common combinations used by mature product teams and are offered here as a starting point, not a prescription.
| Primary metric | Common warning metric |
|---|---|
| Conversion rate | Refund rate, post-purchase NPS, support ticket volume on the conversion flow |
| Engagement (sessions, time-on-app) | Self-reported satisfaction, churn at 30 / 60 / 90 days |
| Active users | Power-user retention, customer-reported value |
| Subscription growth | Cancellation rate, reasons-for-churn distribution |
| Feature adoption | Task completion success, error rate during use |
When the primary moves up and the warning moves the wrong way, the team has not won. They have shifted the cost of growth onto the customer, which is the Wells Fargo failure mode in miniature.
One acid test before any release
A short discipline – combining the assumption-test logic from Olsen with the outcome focus from Torres – is to have the trio answer two questions in writing before shipping anything material:
- Which customer outcome do we expect this to move, and by how much?
- Which warning metrics will we watch, and what reading would cause us to roll back?
If either answer is “we don’t know,” the work is not ready to ship – not because the engineering is incomplete, but because the decision is incomplete. Shipping in that state is gambling, not product development.
8. A 60-Minute Self-Audit: Where Does Your Team Actually Stand?
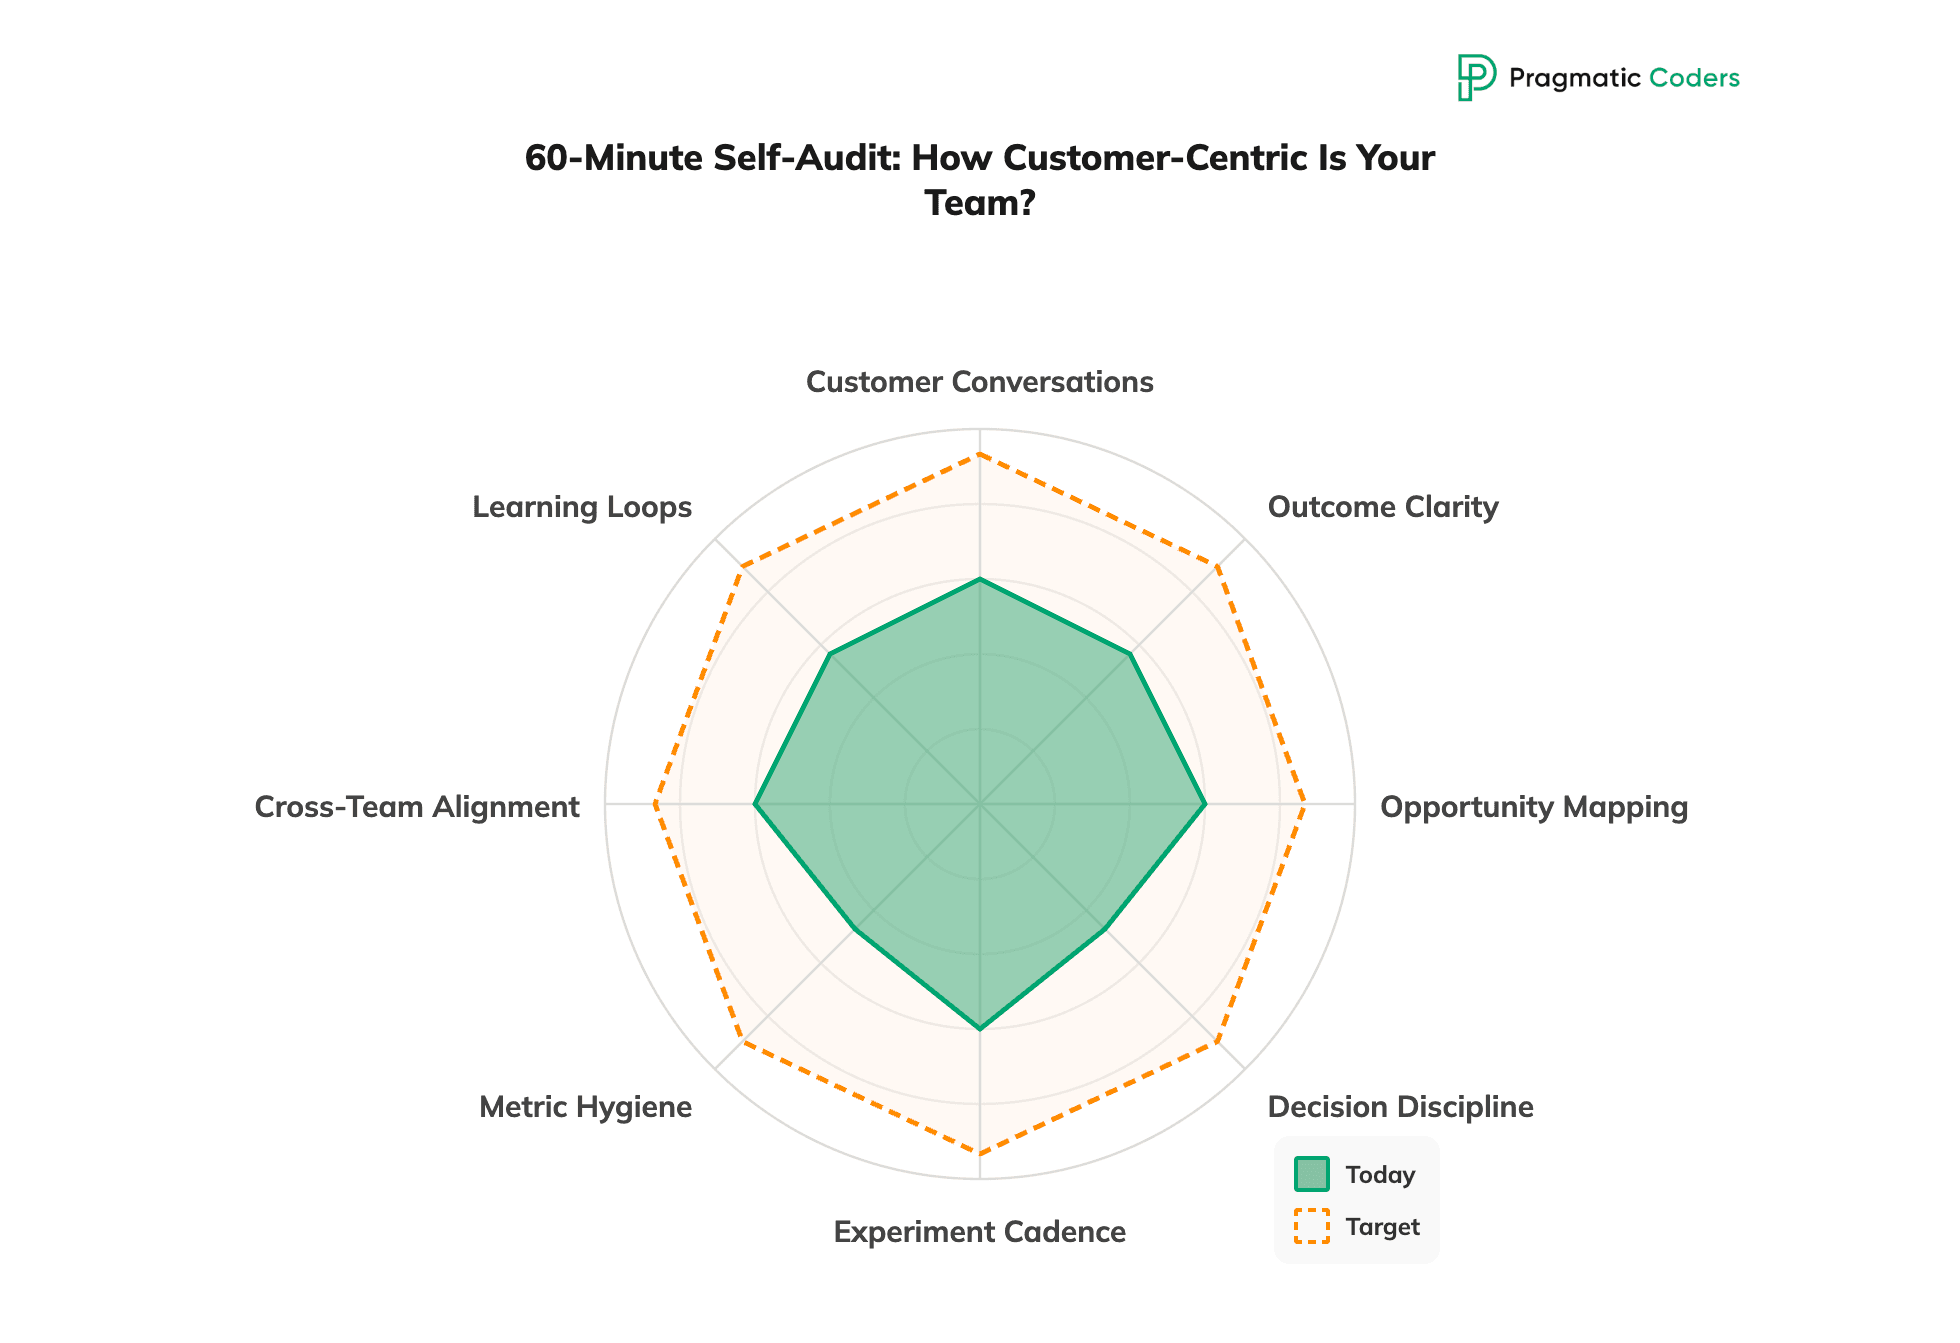
Most teams overestimate their customer-centric maturity. Not out of dishonesty – out of pattern recognition. They recognize the artefacts (research repository, persona doc, OKRs) and assume the artefacts mean the practice is in place. The audit below separates artefact from practice.
It is designed to be run in a single 60-minute session with the trio (PM, design lead, engineering lead). One person reads each dimension aloud. The team scores honestly. The point is not to feel good about the current state – the point is to know which two or three dimensions to fix next quarter.
How to score
Each dimension has three levels. Pick the one that best describes your team today, not where you intend to be:
– 0 – Not in place. The behaviour is absent or happens only opportunistically.
– 1 – In place but inconsistent. The behaviour exists but depends on individuals or specific quarters.
– 2 – Embedded. The behaviour is part of how the team operates by default and would survive a PM rotation.
The eight dimensions
1. Discovery cadence. Does the team conduct interviews with target customers at least weekly, year-round, regardless of release stage?
Score 0 if discovery happens only before major launches. Score 2 if you can name the last three weeks’ interviews without checking the calendar.
2. Trio participation. Do design and engineering attend customer conversations directly, or do they read summaries written by someone else?
Score 0 if engineers have not spoken to a customer this quarter. Score 2 if at least one engineer or designer joined a customer call in the last two weeks.
3. Outcome ownership. Is the team accountable for a customer-side outcome it can articulate in one sentence – or for a feature roadmap?
Score 0 if the team’s quarterly commitments are a list of features. Score 2 if every team member can state the outcome and the metric without notes.
4. Problem framing in customer language. Is each major initiative framed as a customer problem, distinct from the metric it is intended to move?
Score 0 if the framing is “increase conversion by X%” with no customer-side counterpart. Score 2 if a customer could read the framing and recognize themselves in it.
5. Question quality. Do interviewers follow Mom Test discipline – asking about specific past behaviour rather than future intentions, listening more than they talk, distinguishing commitment from compliments?
Score 0 if interviews routinely include questions like “would you use this?” or “do you like this idea?” Score 2 if your last three interview transcripts contain mostly past-tense stories.
6. MVP as test, not as scoped-down v1. When the team builds an MVP, is it explicitly designed to falsify the riskiest assumption – with the minimum investment that produces a clear answer?
Score 0 if “MVP” in your team’s vocabulary means “the first release.” Score 2 if every MVP has a written assumption it is testing and a defined rollback criterion.
7. Outcome metrics paired with warning metrics. Does every primary metric have an explicit guardrail metric the team watches with equal seriousness?
Score 0 if you optimize a single number. Score 2 if your dashboards show primary and guardrail side by side, and a guardrail breach has actually triggered a rollback in the last two quarters.
8. Research-to-decision traceability. Can you point at a roadmap decision made in the last 90 days and trace it back to specific customer evidence – and conversely, can you point at recent research that explicitly closed off a backlog item?
Score 0 if research is filed and roadmap decisions are made elsewhere. Score 2 if every meaningful roadmap change in the last quarter has a named evidence trail.
Reading the score
Add the eight scores. Maximum is 16.
– 0 – 5: Customer-flavoured, not customer-centric. The team has the vocabulary but not the operating model. The risk is high: most decisions are still being made on internal assumptions, with research used as post-hoc justification. The fix is not “do more research” – it is to install one or two of the missing behaviours (usually cadence and outcome ownership) as non-negotiables. – 6 – 10: In transition. The behaviours exist but unevenly. Performance depends on individuals. The next step is to identify the two lowest-scoring dimensions and treat them as quarterly improvement objectives, with the trio – not just the PM – accountable. – 11 – 14: Mature practice with known gaps. The team is genuinely customer-centric on most dimensions. The remaining gaps are usually 7 (warning metrics) or 8 (research-to-decision traceability), which are the hardest to install because they require organizational backing, not just team discipline. – 15 – 16: Few teams genuinely live here. If you scored this honestly, your job is to teach the rest of the org, not to optimize further.
Where to go deeper
The audit above tests the customer-centric decision layer. In practice, three other layers support it – and weakness in any of them will erode customer-centric work no matter how disciplined the discovery becomes.
– Product layer. If the audit surfaces gaps in dimensions 1 – 4 (discovery, framing, outcome ownership), the Product Health Checklist is the deeper diagnostic. It covers product strategy, discovery, and prioritization with an assessment that takes about 30 minutes and produces a prioritized fix list. – Delivery layer. If discovery is solid but the team cannot move learning into shipped product fast enough, the bottleneck is the delivery system. The Scrum Health Checklist audits the rituals, roles, and decision flow that determine whether discovery insights actually become product. – Engineering layer. If the team ships fast but quality, technical debt, or platform constraints keep punching holes in customer experience, the Technical Health Checklist covers code quality, architecture, observability, and the engineering practices that make sustained customer-centricity feasible at scale.
A senior PM with all three checklists in hand has a complete view of where customer-centric work breaks down – at the decision layer, the delivery layer, or the engineering layer – and a structured fix list for each.
9. Frequently Asked Questions About Customer-Centric Product Development
What is customer-centric product development in one sentence?
Customer-centric product development is the practice of grounding every meaningful product decision – problem definition, prioritization, design, release, and iteration – in evidence about real customer behaviour and validated customer outcomes, rather than internal assumptions or stakeholder opinions.
What is the difference between customer-centric and customer-led product development?
Customer-centric means the customer is the primary input to product decisions, using expert judgment to solve the right problems. Customer-led means the customer is the decision-maker, often resulting in roadmaps that are literal transcripts of requests without synthesis. The mature stance is customer-centric.
How is customer-centric product development different from design thinking?
Design thinking is a methodology or sequence of stages typically applied at the start of a project. Customer-centric product development is an operating model that runs continuously across the entire product lifecycle. Design thinking is a tool within the practice, but not the practice itself.
How is it different from agile?
Agile is about how you build (process), while customer-centric is about what and why you build (strategy). They are complementary: agile provides the cadence to act, and customer-centricity ensures you are iterating toward something the customer actually wants.
How do you measure customer-centricity?
Mature teams track three layers in parallel:
Process metrics: Frequency of touchpoints and involvement of the product trio.
Outcome metrics: The actual change the product drives (e.g., time saved, retention).
Warning metrics: Guardrails like refund rates or churn to ensure growth doesn’t come at the customer’s expense.
How often should we do customer interviews?
At least weekly, year-round. The goal is to ensure the team’s understanding of the customer is never more than seven days stale. Interviewing only “when there is time” leads to decisions based on outdated information.
What is a customer-centric MVP?
An MVP is the smallest possible artefact—such as a landing page, prototype, or concierge service—that lets you test the riskiest assumption behind an idea. It is not “v1 with fewer features,” but rather whatever allows you to learn the most with the least investment.
What is the role of a Product Manager in customer-centric development?
The PM is the steward of decision quality, not the author of the solution. Their job is to ensure evidence exists, the trio uses it, and the right assumptions are tested. They don’t just “represent” the customer; they bring the customer into the room.
What are the most common customer-centric product development frameworks?
The three most influential are:
Teresa Torres’ Continuous Discovery (Opportunity Solution Tree).
Rob Fitzpatrick’s The Mom Test (high-signal conversations).
Dan Olsen’s Lean Product Process (Product-Market Fit Pyramid).
How do you start being more customer-centric if your organization is not?
Start with the smallest unit you control: your own team. Establish one weekly customer touchpoint and cite specific evidence for every roadmap decision. Changing the team and producing visibly better outcomes is the best way to eventually convince the wider organization.
10. The Bottom Line
The teams that win in modern product markets are not the ones with the largest research budgets, the prettiest persona docs, or the most ambitious OKRs. They are the teams whose product decisions are demonstrably grounded in real customer behaviour, who frame problems in customer language before generating solutions, who treat MVPs as tests of risky assumptions rather than scoped-down launches, and who measure success in customer-side outcomes paired with warning metrics that protect against the metric becoming the goal.
Customer-centric product development is not a posture, a methodology, or a quarterly initiative. It is a way of making decisions, repeated across thousands of small choices over months and years. The practices in this article – the continuous discovery rhythm, the Mom Test interview discipline, the Product-Market Fit Pyramid, the Opportunity Solution Tree, the assumption-driven MVP, the warning-metrics paired with primary metrics – are the operating tools. The audit in Section 8 is the diagnostic. The checklists are the fix lists.
Three things to do this week:
- Run the 60-minute audit in Section 8 with your trio. Score honestly. Pick the two lowest dimensions as your improvement objectives for next quarter.
- Install one weekly customer touchpoint if you do not have one. The trio attends. Recordings get shared. By week four, you will see decisions starting to shift.
- Take the Product Health Checklist for the deeper assessment of your product layer – or the Scrum Health Checklist and Technical Health Checklist if your audit pointed at the delivery or engineering layer.
The organizations that compound customer trust, retention, and pricing power over the next decade will be the ones whose product teams installed these behaviours by default. The rest will keep shipping features that nobody asked for, wondering why their growth metrics stopped responding to roadmap velocity.
The choice of which one to be is made every Monday morning.
Sources & Inspirations
This article synthesizes ideas from three foundational books, several adjacent practitioners, and our own observations from working with product teams. We separate the three explicitly so readers can trace each idea to its origin and decide what to read next.
Primary Sources – The Three Foundational Books
The core of this article is built on three pillars of product literature:
Teresa Torres, Continuous Discovery Habits (2021): Source for the weekly discovery cadence, the product trio model, the Opportunity Solution Tree, and the outcome-over-output discipline.
Rob Fitzpatrick, The Mom Test (2013): Source for high-signal interview rules, the commitment-vs-compliment distinction, and focusing on past behavior over future intent.
Dan Olsen, The Lean Product Playbook (2015): Source for the Product-Market Fit Pyramid, the six-step Lean Product Process, and the problem-space vs. solution-space distinction.
Secondary Sources and Adjacent Practitioners
Additional frameworks and concepts integrated into the text include:
Anthony Ulwick: Outcome-Driven Innovation and prioritization heuristics.
Marty Cagan (SVPG): The “four big risks” (value, viability, feasibility, usability), extended here to include ethics.
Dave McClure: Startup Metrics for Pirates (AARRR), reframed for customer-side outcome quality.
Goodhart’s Law & Guardrail Metrics: The conceptual basis for warning-metrics as practiced by firms like Microsoft, Airbnb, and Spotify.
Peter Drucker: The foundational framing that “the purpose of a business is to create a customer.”
Our Own Synthesis
The following elements are original compilations and frameworks developed for this article:
The Four-Move Unified Decision Framework: Integrating outcome, opportunity, filters, and process into one workflow.
The Six-Step Diagnostic Process: A structured sequence including “common mistakes” and “signals you are done.”
Industry Anti-patterns: Specific observations on the “vocal minority,” “research theatre,” and “customer-led confusion.”
The Metrics & Audit Tools: The primary-vs-warning metrics table, the “two-question acid test” for releases, and the 60-minute self-audit scoring instrument.
Industry Data & Research
We reference key benchmarks used to measure the impact of customer-centricity:
Revenue Growth: The 2.5x growth figure associated with customer-centric leaders (sourced from Berkley).
Feature Underuse: The data showing 64–80% of features are rarely or never used (sourced from Standish Group and Pendo).