What is the bus factor?
Bus factor is one of the most important terms when it comes to technical debt, legacy system, and the overall health of your project. The lower it is, the worse for you. That’s why in this article, we explain what it is, why it goes low, and how to make it higher.
- Learn more about how to diagnose your project. Be sure to download our ebook Is your project on fire? Self-diagnosis:
![Is your project on fire [EBOOK]](https://www.pragmaticcoders.com/wp-content/uploads/2026/02/Is-your-project-on-fire-EBOOK.png)
What is the bus factor?
Bus factor (a.k.a. truck factor) is a risk metric for a team/project: it’s the minimum number of people who would have to suddenly become unavailable (e.g., quit, get sick, be reassigned—“hit by a bus”) before the project can’t be maintained or delivered.
- Bus factor = 1 → very risky: one key person holds critical knowledge/access.
- Higher bus factor → more resilient: knowledge, ownership, and access are spread across multiple people.
Why does the bus factor even happen?
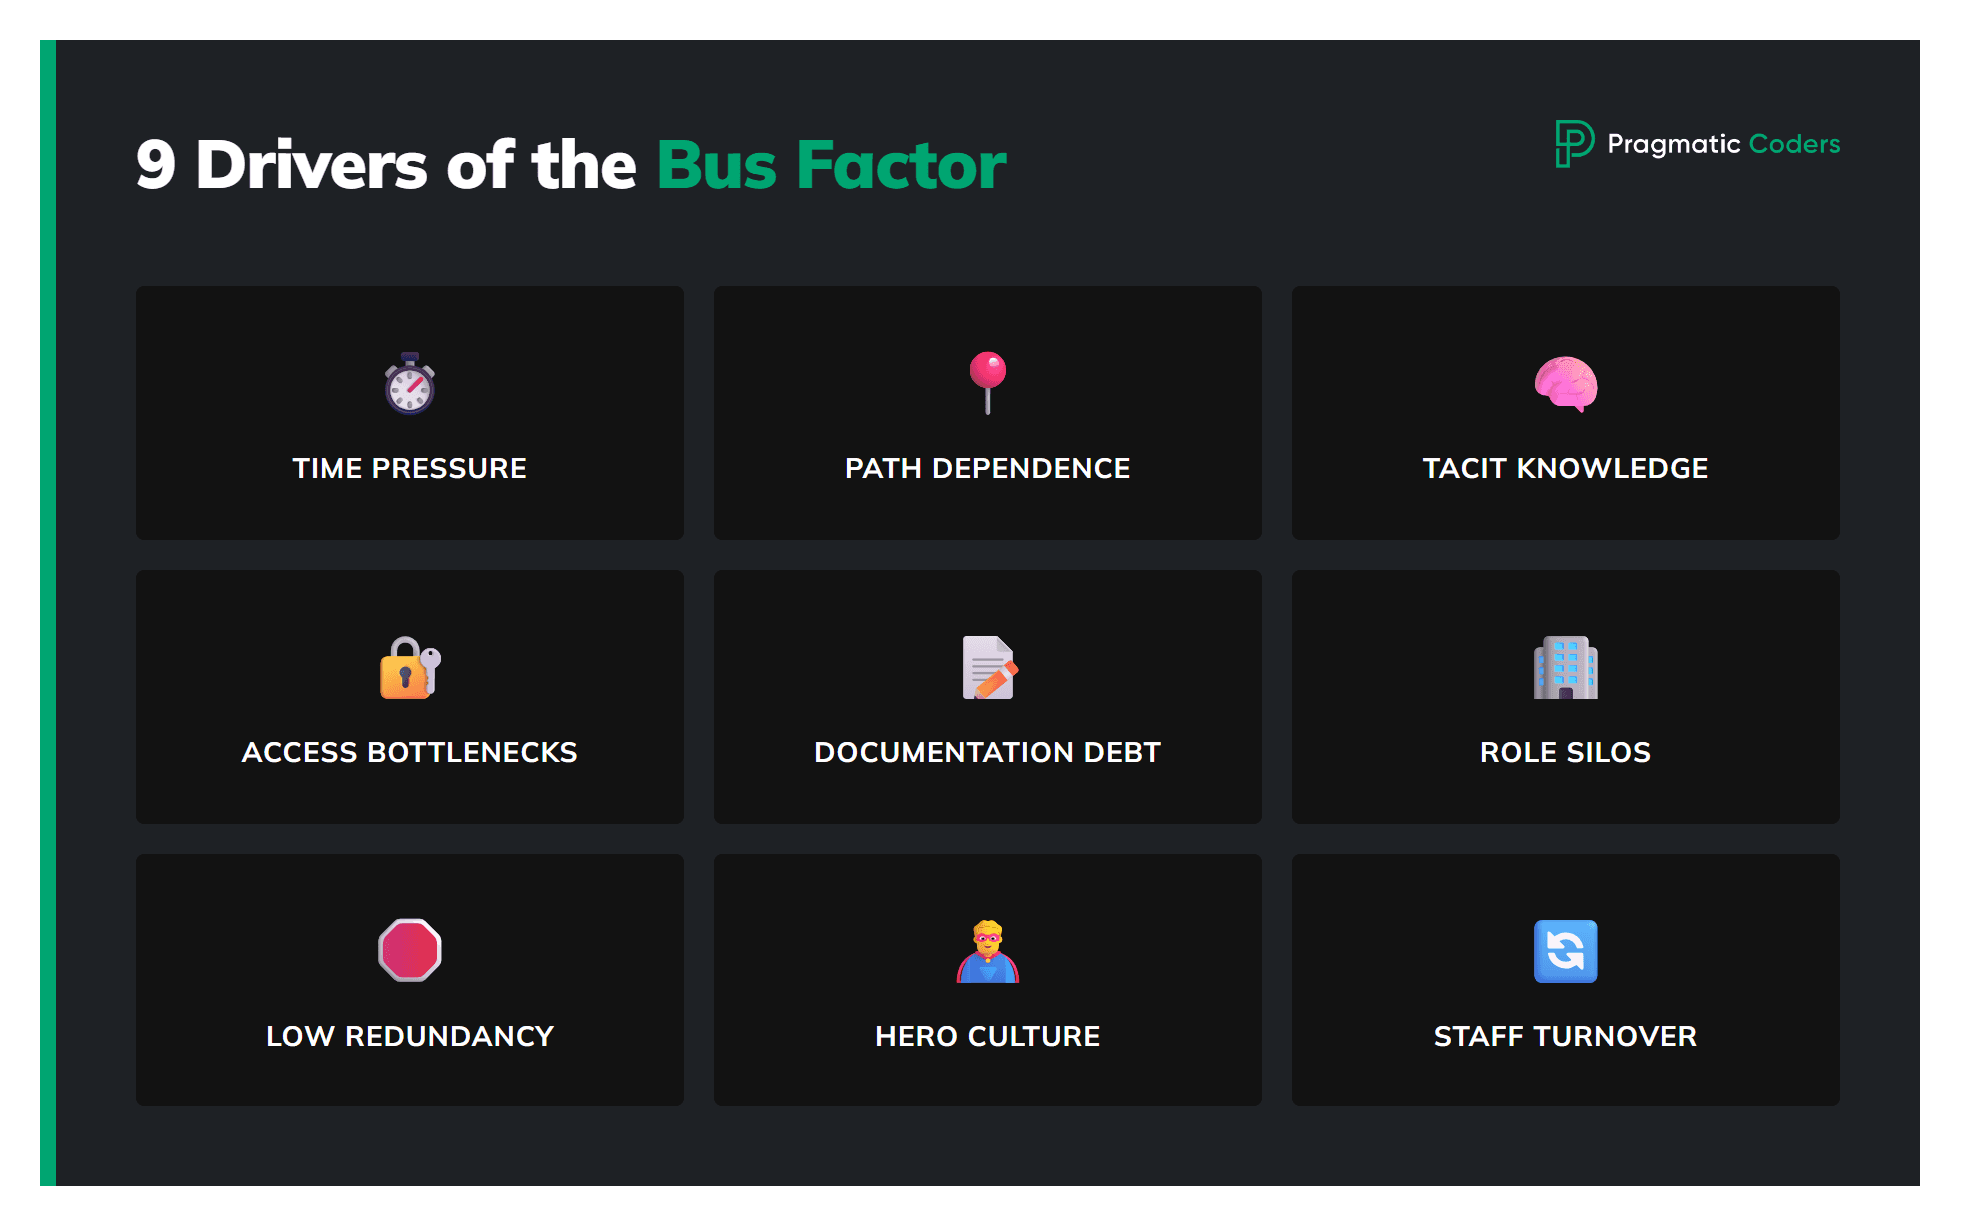
Bus factor happens because critical knowledge, access, and decision-making naturally concentrate unless you deliberately counteract it. The main drivers:
Time pressure and “get it done” incentives
- The fastest path is often “let the person who already knows it handle it,” which reinforces specialization.
Path dependence / first-mover ownership
- The person who built a system becomes the default maintainer because they know the context, shortcuts, and history.
Tacit knowledge
- A lot of know-how isn’t written down: mental models, gotchas, “why we did it this way,” troubleshooting instincts.
Access bottlenecks
- Credentials, admin rights, vendor relationships, and deploy permissions often live with one person “for safety” or inertia.
Weak documentation + high context
- Systems evolve faster than docs; documenting feels slower than shipping, so documentation debt grows.
Org design and roles
- Single “owner” roles, silos, or a lone specialist (data, analytics, marketing ops, DevOps, CRM) create single points of failure.
Low redundancy by default
- Training a second person costs upfront time; many teams don’t budget for that until something breaks.
Hero culture
- People get rewarded for being the fixer or sole expert, unintentionally discouraging sharing and delegation.
Turnover and churn
- When people rotate projects quickly, whoever stays becomes the knowledge anchor—and then a single point of failure.
How to tell how low your bust factor is?
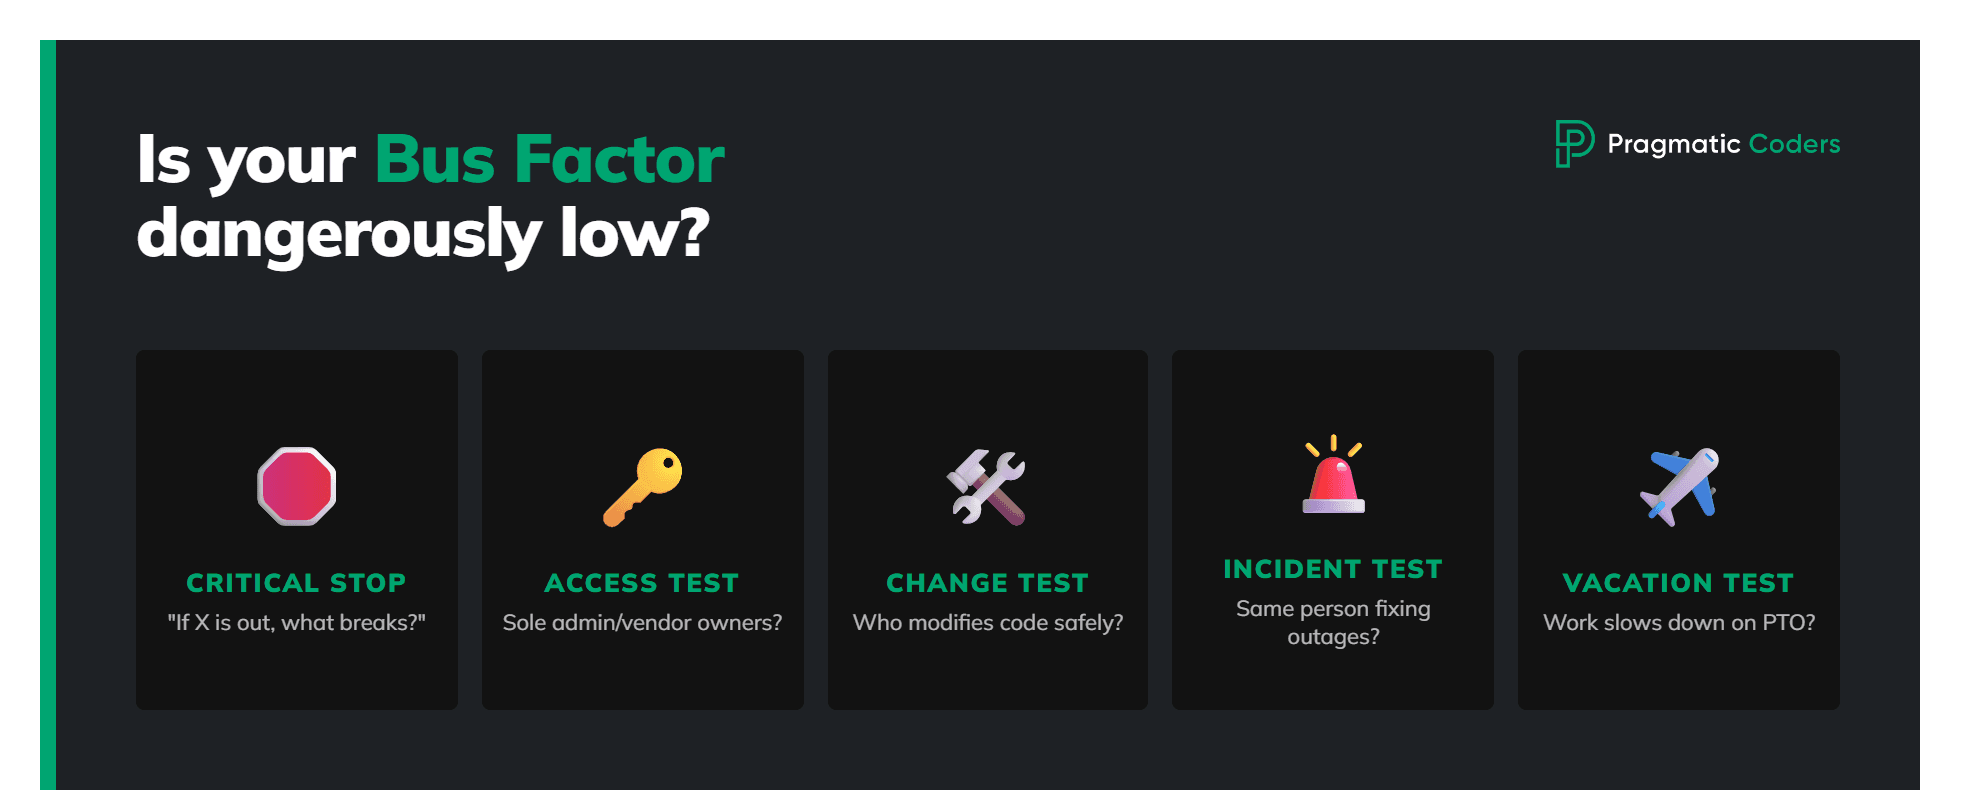
You don’t “have” a bus factor—you always do. The question is whether it’s dangerously low. Here is a practical way to tell.
- “If X is out for 2 weeks, what stops?” If you can name a person and a dependency chain, that area’s bus factor is ~1.
- Access test: “Who can deploy / approve / access prod / manage the CRM-ad account / renew vendors?” If the answer is one person, bus factor ~1 for that capability.
- Change test: “Who can safely modify this system without asking someone?” If only one person can, the bus factor is low.
- Incident test: Look at the last 3 outages/escalations—who fixed them? If it’s the same person repeatedly, that’s concentration.
- Vacation test: Do things slow down when certain people are on PTO? If yes, those are single points of failure.
How to calculate the bus factor?
You “calculate” the bus factor by translating the definition into something countable:
Bus factor = the minimum number of people who must become unavailable for the project to stop.
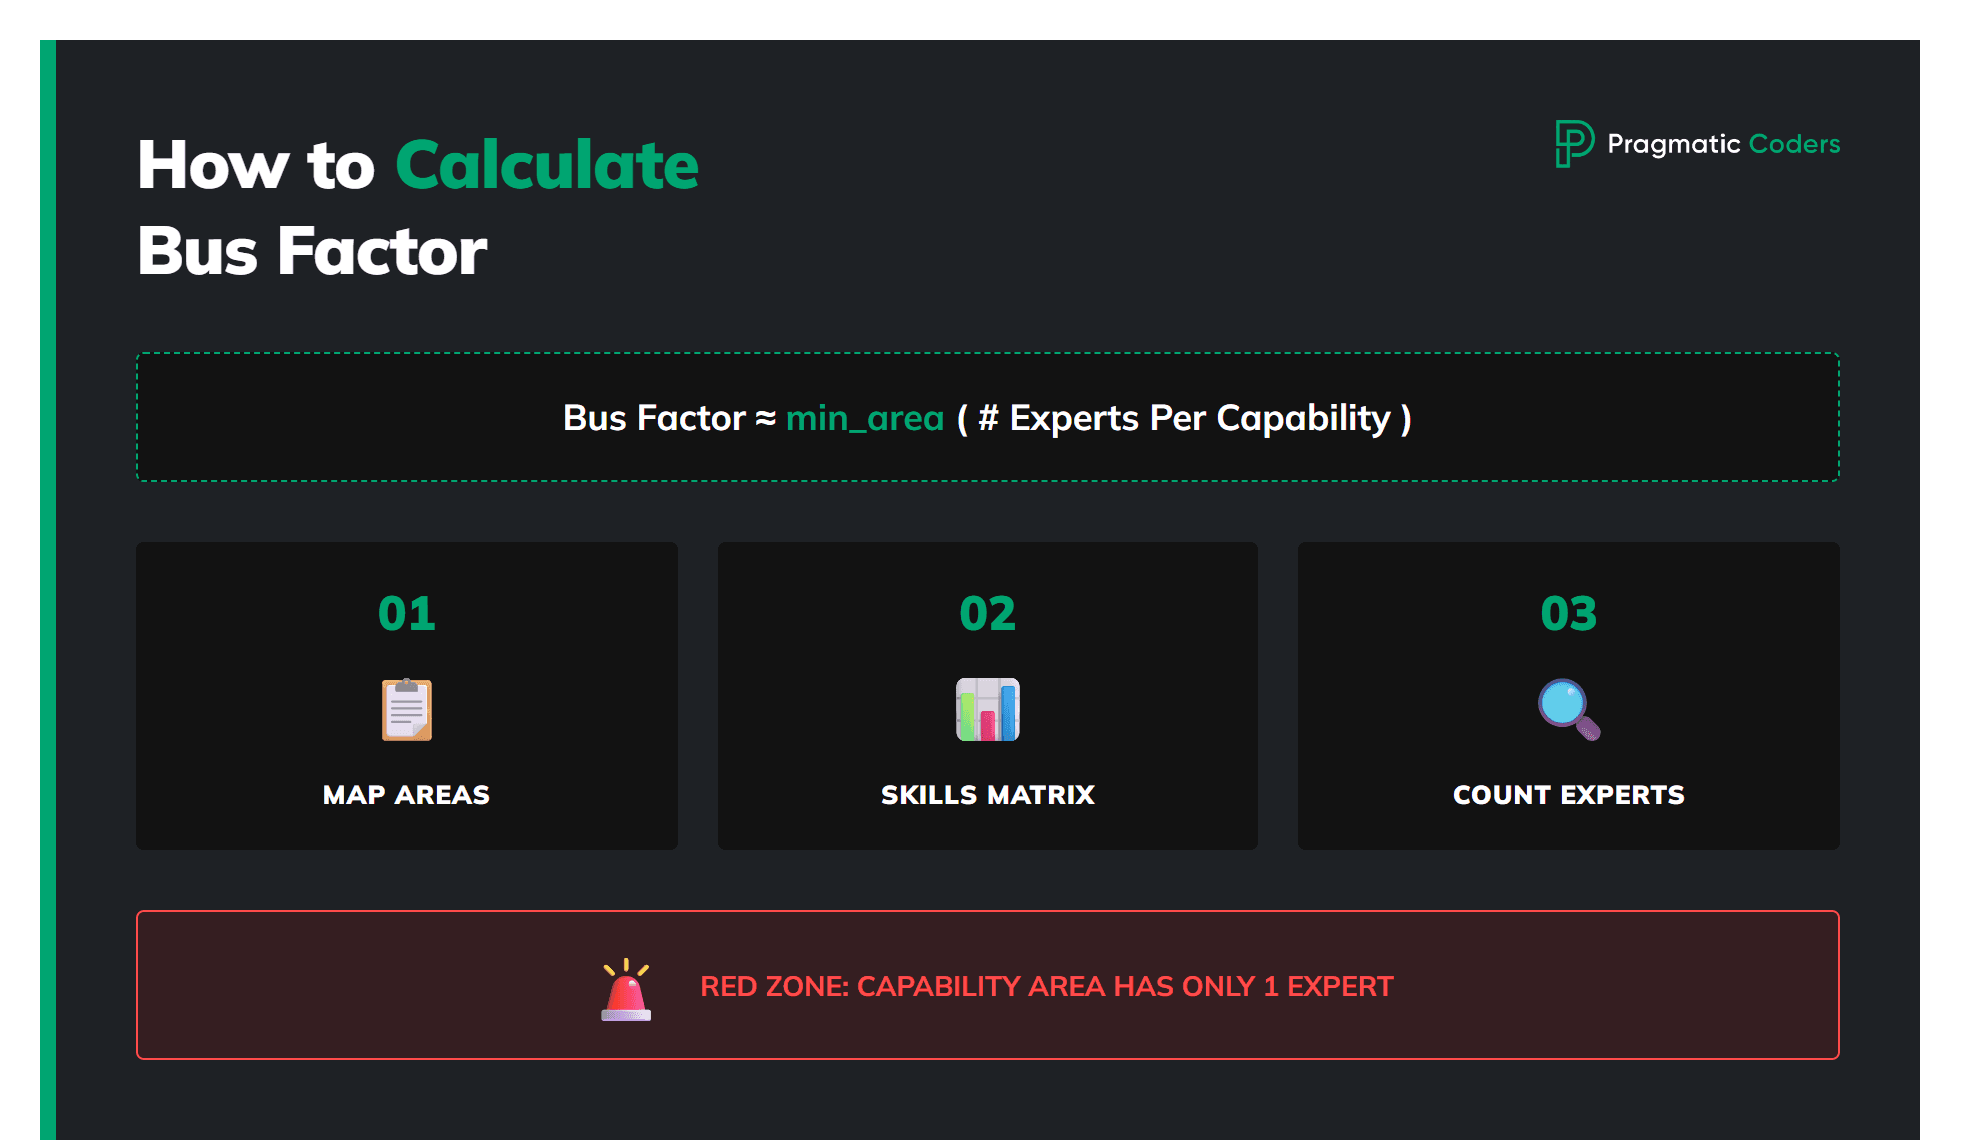
In practice, the cleanest way is: treat the project as a set of key capability areas, and count how many people can cover each one end-to-end.
- List key technical + business areas (e.g., deploy/release, incident response, billing, key integrations, reporting, critical client knowledge, etc.).
- Create a skills matrix with ratings 1–4 (1 = doesn’t know, 4 = expert).
- For each area, compute coverage = number of people rated 3–4 (i.e., can handle it without hand-holding). This is exactly what the ebook calls out as the “red zone” test: red zone = only one person at level 3–4.
- Your project bus factor (operationally) is the minimum coverage across all critical areas:
- bus_factor ≈ min_area( #people_with_level_3_or_4_in_area )
So if deploy has 2 capable people, reporting has 3, but a core integration has only 1, then bus factor ≈ 1 (because that single point can still paralyze the project).
How to calculate the bus factor – EXAMPLE
| Example team | Rating scale |
| Ania (backend) Bartek (DevOps) Kasia (data) Tomek (frontend) Ewa (PM / ops) |
|
Step 1: Define “areas” (capabilities)
Pick the things that, if nobody can do them, the project stops.
Example areas:
- Production deploy & rollback
- Payments & billing (Stripe)
- Core API (order service)
- Data pipeline & reporting
- Frontend release & feature flags
- Incident response / on-call runbooks
- Key customer onboarding workflow
Step 2. Skills matrix example (1–4 scale)
(3–4 = can do independently)
| Area | Ania | Bartek | Kasia | Tomek | Ewa |
| 1) Deploy & rollback | 2 | 4 | 1 | 1 | 1 |
| 2) Payments & billing | 3 | 2 | 1 | 1 | 2 |
| 3) Core API | 4 | 2 | 1 | 1 | 1 |
| 4) Data pipeline | 1 | 1 | 4 | 1 | 2 |
| 5) Frontend release | 1 | 1 | 1 | 4 | 2 |
| 6) Incident response | 2 | 3 | 2 | 1 | 2 |
| 7) Customer onboarding | 2 | 1 | 2 | 1 | 3 |
Step 3. Coverage count per area (≥3)
Define coverage(area) = number of people with score ≥ 3 (can do independently).
- Deploy → Bartek = 1
- Payments → Ania = 1
- Core API → Ania = 1
- Data pipeline → Kasia = 1
- Frontend release → Tomek = 1
- Incident response → Bartek = 1
- Onboarding → Ewa = 1
Step 4. Bus factor calculation
Project bus factor ≈ min coverage across critical areas
- Minimum coverage here is 1
- So bus factor = 1 (lots of single points of failure)
What to do with your bus factor?
We propose a concrete, repeatable approach:
First, calculate the bus factor as above.
Then:
1) Assign 1–2 backups for each “red zone”
A “red zone” is any important area where only one person can handle it well (level 3–4 in the matrix).
Example (simple):
- “Monthly client report” → only Kasia knows how to do it → red zone.
- Choose backups: Ewa (Backup A) + Ania (Backup B).
Is your project on fire_ Self-d…
How to do it in 20 minutes:
- Make a list of your key areas (10–20).
- For each one, write:
- Owner (rockstar) = the person who always does it now
- Backup A + Backup B = the people who will learn it next
That’s it. You’re turning “tribal knowledge” into an explicit plan.
2) Mini playbooks (short “how it works” notes)
Next, the rockstar writes down the most important “how it works” in a short, practical format.
Think: 1 page max. A good mini playbook answers:
- What is this for?
- Where do I go / what do I open?
- Step-by-step checklist
- Common mistakes + how to fix
- Where passwords/access live (or who grants access)
Example: Kasia writes “Monthly client report – mini playbook”
- Link to the spreadsheet/dashboard
- “Click this, export that, paste here”
- “Before sending: check 3 numbers”
- “If numbers look wrong: do these 2 checks”
3) Rotate responsibility (someone else does it for real)
Someone other than the rockstar does the task.
How to run a rotation without chaos:
- Pick one upcoming real task in that red zone.
- Assign it to Backup A as the “doer”.
- Rockstar’s role is only:
- be available,
- review the output,
- answer questions.
Example:
- Next monthly report:
- Ewa prepares and sends it.
- Kasia watches/reviews, but does not take over.
A simple rule that works: “Hands on keyboard belongs to the backup.”
4) Re-check every 4–6 weeks (are we less dependent now?)
Update regularly: every 4–6 weeks check if the bus factor is improving or still 1.
Keep the check-up lightweight (30 minutes):
- Revisit the red zones list.
- For each area ask: “Is there now at least one backup who can do it end-to-end?”
- If yes → red zone is “resolved” (or at least improved).
- If no → schedule the next rotation + update the mini playbook.
A simple scoreboard
- Red zones total: 8
- Red zones with backups who can do it: 3
- Goal next month: 5
Conclusions
The higher the bus factor, the better for you. Hopefully, this article will help you recognize it and keep it at a good, high level.
What’s next?
If you need to diagnose your project even more, check our:
- Ebook on “self-diagnosis” of a project
- Product health checklist
- Diagnostic guide on the four hidden bottlenecks behind underperforming IT teams (a low bus factor is one of them; the other three are worth ruling out too)
If you still need help, reach out to us and ask for a project audit – we’ll definitely help.

Bus factor FAQ
What is a bus factor of 1?
A bus factor of 1 means there’s exactly one person whose absence would stop the project (or a critical part of it) from being maintained or delivered. In practice, it usually shows up as: one person who can deploy/release safely, one person who understands a core integration, one person who “always fixes prod,” or one person holding essential credentials or vendor relationships.
How do you calculate the bus factor?
A practical way is to treat the project as a set of critical capability areas and measure coverage for each area:
1) List key areas that would block delivery if nobody could handle them (e.g., deploy/rollback, incident response, key integrations, billing, reporting).
2) Build a skills matrix (e.g., 1–4 scale where 3–4 = can do independently).
3) For each area, compute coverage(area) = number of people rated 3–4.
4) Bus factor ≈ min_area(coverage(area)).
If any critical area has coverage = 1, your project’s bus factor is effectively 1.
What is the value of the bus factor?
“Value” depends on context, but typical interpretation bands are:
– 1: critical risk (single point of failure)
– 2: fragile (some redundancy, still easy to block)
– 3–4: healthy for many small/medium teams (work continues despite one absence)
– 5+: very resilient (more common in larger, well-documented orgs)
A common target: at least 2 people can handle every critical area end-to-end, and 3 for the most business-critical ones (deploy, incident response, payments, core domain logic).
What is the bus factor in development?
In software development, bus factor measures how concentrated critical engineering knowledge and access are across architecture decisions (“why”), deployment/release, production access and incident response, key code paths/modules, infrastructure/DevOps and vendor dependencies, data pipelines/reporting, and client-specific workflows. A low bus factor increases delivery delays, outage duration, onboarding time, and technical debt because changes funnel through a small number of “keepers of context.”
Why is bus factor often lower than teams think?
Teams often count people who could “help,” not people who can do the work independently under time pressure. The right test is: “Who can complete this end-to-end without needing the expert?” If the answer is one person, that area’s bus factor is effectively 1.
What are the fastest ways to improve bus factor?
Three high-leverage moves:
1) Assign Backup A + Backup B for every “red zone” (areas with only one person at level 3–4).
2) Write mini playbooks (1 page max): purpose, where to go, checklist, common mistakes, how to get access.
3) Run real rotations: the backup does the task (“hands on keyboard belongs to the backup”), the expert only reviews and answers questions.
How often should you re-check bus factor?
Every 4–6 weeks is a good cadence. Keep it light (30 minutes): revisit red zones and confirm whether at least one backup can now do each area end-to-end.
Can different parts of the same project have different bus factors?
Yes. It’s common to have higher coverage in “visible” areas (e.g., frontend) and lower coverage in sharp-edge areas (infra, billing, legacy integrations, data pipelines). Operationally, the weakest critical area sets the effective bus factor.