Where Technology Creates Financial Risk: Key Areas for CFOs
You usually find out about technology risk too late — once the company is already paying for it. The system goes down at peak sales, customers report they can’t finish a purchase, and the cloud bill climbs faster than the customer base. Nobody flagged it as a risk until the bill got large. Those effects hit suddenly or build for months; you usually see them only after the fact. There are four areas where technology most often creates this cost, and each one requires a decision: reduce the risk now, or knowingly accept it.
Key Points
|
How to Read Technology Risk as Financial Exposure
In simple terms, financial risk from technology is the probability that something will happen, multiplied by the impact. And impact is scale (how many customers or transactions the problem affects) times how long it lasts.
Risk = Probability × Scale × Duration
For a CFO, the reference point is the company’s revenue model. In e-commerce, a payment outage directly stops sales. In a subscription model, product instability can increase cancellations over the following months. Assessing exposure therefore means linking key business processes to the systems those processes depend on for continuity.
You care about the financial consequences of the health of the technology stack, not the code itself. Overseeing IT without reading code works the same way: questions about outcomes, not implementation. So from the technical team you need answers to three questions:
- how likely a given scenario is,
- how much of the business it can affect,
- how long recovery will take.
The technical team will estimate probability, scale, and time; you, together with the business, will translate that into cost and compare it with the price of reducing the risk. Only then do you decide whether the company should reduce the risk or knowingly accept it.
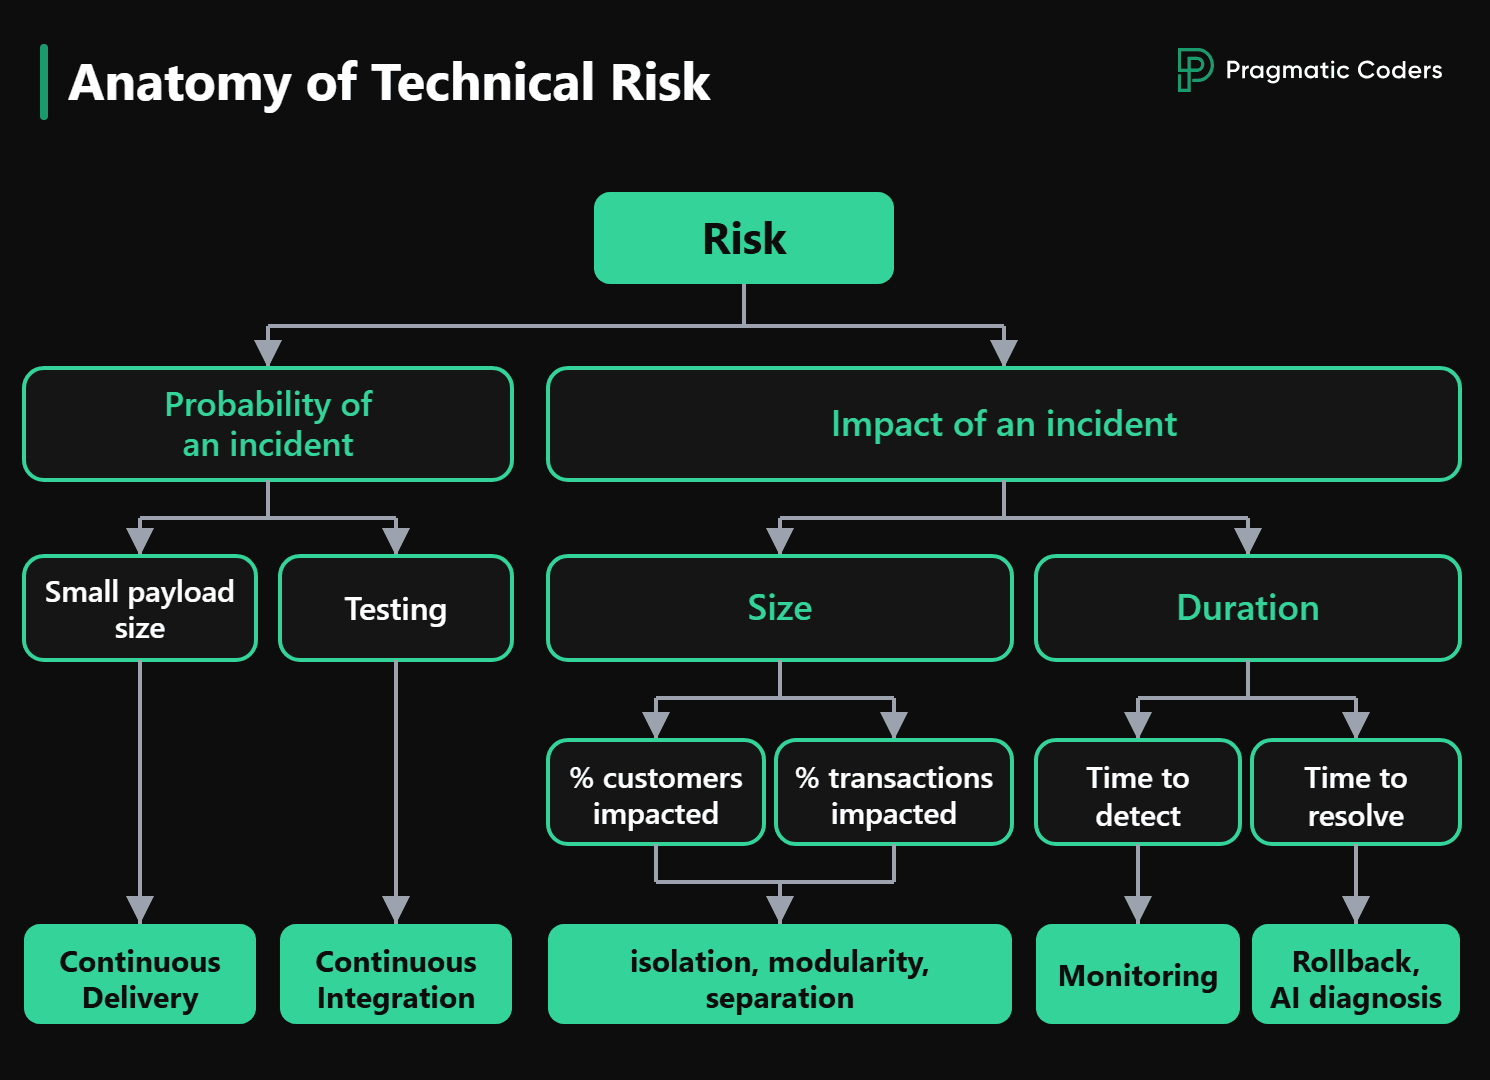
The diagram breaks risk into three elements worth considering separately:
- Impact scale is how many customers or transactions the problem can affect. Depending on the business model, that can mean lost sales or a rise in cancellations.
- Duration covers the period from when the problem occurs to when it is detected, and then to when normal operation is restored.
- Probability is assessed by the technical team based on the system’s condition and the safeguards in place, such as tests, monitoring, and procedures for deploying changes safely.
The next sections cover the four areas where this exposure is often greatest: outages and downtime, data, security, and architecture.
1. Outages and Downtime: The Cost of Disrupting Critical Processes
One of the typical scenarios is an application overload during a period of heavy traffic. As user numbers grow, response times stretch, errors appear, and critical processes stop working. The source of the problem can also be a failure in a single critical system. The rest of the application may work fine, but from the user’s perspective the product no longer does its job. So a failure in one component can have the same effect as a full outage.
The total cost of an outage depends not only on the incident itself, but also on how quickly normal operations can be restored. If the team has no proven procedures for handling outages, even a small fault can turn into a long downtime and real financial losses.
Suppose the last period of heavy traffic showed the system couldn’t cope. In that situation, it is worth estimating what it would cost to strengthen the system so it handles similar overloads better in the future. That estimated cost is worth comparing with the potential financial loss the company could incur from the next similar incident. Only then can you make a rational investment decision.
When an Outage Isn’t Obvious at First Glance
Outages nobody notices in time are especially costly. The page loads, infrastructure monitoring reports nothing, yet adding a product to the cart ends in an error and the purchase fails. For the user, that is an outage, even though the server status panel looks fine. Until someone reports the problem, the company loses revenue. So you need to monitor the processes the company earns money from, not only technical metrics.
Not every part of the system needs an equally fast response. A fault in an add-on used by some customers can wait. An outage in checkout or login, without which the product stops working, hits the company immediately. Those are exactly the processes to monitor most closely, so their failures are caught in real time rather than only through customer reports.
Outage Cost Starts When It Happens, Not When You Detect It
Incident duration is counted from when it occurs, not from when it is detected. If you learn about it from a customer, you may not even know how long the company has been losing money.
The second part of that time depends on how fast the cause of the outage is identified. A team with access to logs, alerts, and change history finds it in a dozen or so minutes. Without those tools, the same diagnosis can take several days, and losses grow the whole time. From a financial perspective, it pays to make sure you don’t learn about outages from customers.
2. Data Loss and Inconsistency: Costs That Show Up Late
With data, the problem is not that the system is unavailable. Data disappears, gets corrupted, or no longer adds up, and the consequences surface later: manual record fixes, bad decisions, loss of customer trust, or legal consequences.
The first scenario is backups. Backups may run irregularly, cover only part of the records, or never get tested (for example, nobody has ever tried restoring data from them). A database failure then means not only downtime, but a real risk that the company cannot recover the lost information and return to normal operations.
The second scenario is data inconsistency: after a failed deployment, a migration, or a series of manual corrections, the system still runs, but the numbers no longer add up. The team fixes them by hand, outside the system. Each of those fixes costs time and raises the risk of another error. In SaaS, before you request that kind of fix, check whether financial reports don’t match across sources because each one records the transaction in a different period.
A separate case, closer to security and access control, is losing control of data held outside the company. It is easy to miss when changing a vendor or integrator: the collaboration ends, but the data stays with the former partner. Until there is confirmation that it has been deleted, there is a risk of a leak. If the leak involves sensitive data, the company will pay for the response, and loss of trust may push some customers to the competition.
3. Security Incidents: The Cost of Unauthorized Access
A security incident can start with a compromised account, an exposed access key, or an unpatched software vulnerability. Financial effects appear when someone gains access to data or functions they should not use. The company then pays to contain the incident, secure the system, and restore normal operation. It may also lose customers and, in regulated industries, pay a fine.
From a CFO’s perspective, what matters is the scale of possible consequences: which data and operations an unauthorized person could access, and how many customers the incident would affect. Separately, it is worth assessing whether the team will be able to quickly detect a breach and establish how it unfolded, because that determines how long the exposure lasts and how much the bill grows.
Risk rises when permissions are too broad, keys and passwords are not properly protected, known vulnerabilities stay unpatched, and the system does not log the activity needed to detect and analyze an incident.
So it is worth asking the team what type of incident could cost the company the most, how quickly the team will be able to detect it, and which safeguards would most reduce its potential cost.
4. Architecture: Maintenance Cost and Scaling Limits
Here risk rarely takes the form of one high-profile incident. More often, maintenance and development costs climb: each successive change takes longer, IT eats up more and more of the budget, and when you scale or add a new integration, it turns out the system needs an expensive rebuild.
System architecture is the result of decisions that are expensive to reverse later. Mistakes often stay invisible for a long time because the system still works. They surface only when every new feature takes more and more work, when infrastructure costs grow faster than the customer base, and when adapting the system as the business grows requires rebuilding a large part of it.
That is why architecture is a business decision, even if the company treats it as a purely technical matter. And since it is a business decision, the CFO should know who makes it and on what basis. Before a specific solution is chosen, does someone in the company assess:
- how much that solution will cost to maintain,
- what risk it carries,
- whether it can support the growth plans for the next few years.
Same Event, Different Bill
How the system is designed determines how costly an incident becomes. Take an integration with an external provider. If its failure stops the entire product, the effects hit every customer. If the integration is isolated from the rest of the system, other functions keep working, and the problem affects only customers who use it. Isolation does not lower the probability of failure in the integration itself, but it limits its reach and cost.
How to Assess Risk Before the Company Pays for It
You already know the four areas where technology creates financial risk. Now you need to establish which of those threats actually apply to your system and what losses they could cause. You cannot assess that from financial data alone. You need an assessment from the technical team.
Give your CTO or technical lead the technical product health checklist. It covers the same areas we discussed: the system’s resilience to outages and downtime, data, security, and architecture. Once the technical team completes it, you will learn:
- which technical practices are in place and which are not,
- where risk is highest,
- what business effects those gaps can trigger, for example, downtime, data loss, a leak, or rising maintenance cost.
That is enough for you to gauge the scale of exposure and decide: reduce the risk, or knowingly accept it. Where you choose to reduce it, you will see the effect in metrics that show the financial impact of the health of the technology stack: cost of downtime, mean time to repair (MTTR), or cloud cost per customer.
If the checklist reveals isolated gaps, the team can address them one by one. But if the problems come from how the whole system is built (for example, every change is getting more expensive, scaling requires rebuilding a large part of the application, and maintenance cost is growing faster than the business), local fixes will not remove the source of the risk. That is the moment to consider a system rewrite.
Conclusions
Technology creates financial risk mainly in four areas: outages and downtime, data, security, and architecture. In each of them, the same factors matter: how many customers or transactions the problem can affect, how long it will last, and what it will cost.
The biggest losses arrive in two ways. Sometimes exposure shows up suddenly, at peak sales, during a deployment, or on the day of a security incident. More often, though, it builds for months out of sight: in untested backups, rising maintenance cost, or gaps the company only discovers once it starts really paying for downtime, data loss, or an expensive system rebuild.