Technical Health Checklist: products don’t crash, they calcify
This is technical calcification: the product works, but change gets slower, riskier, and harder to explain.
The Technical Health Checklist shows exactly where the product is hard to change, hard to test, hard to deploy, or hard to recover.
The goal is simple: fix the constraints that are slowing delivery before they start deciding the roadmap.
Take The Technical Health Checklist
What the checklist actually measures
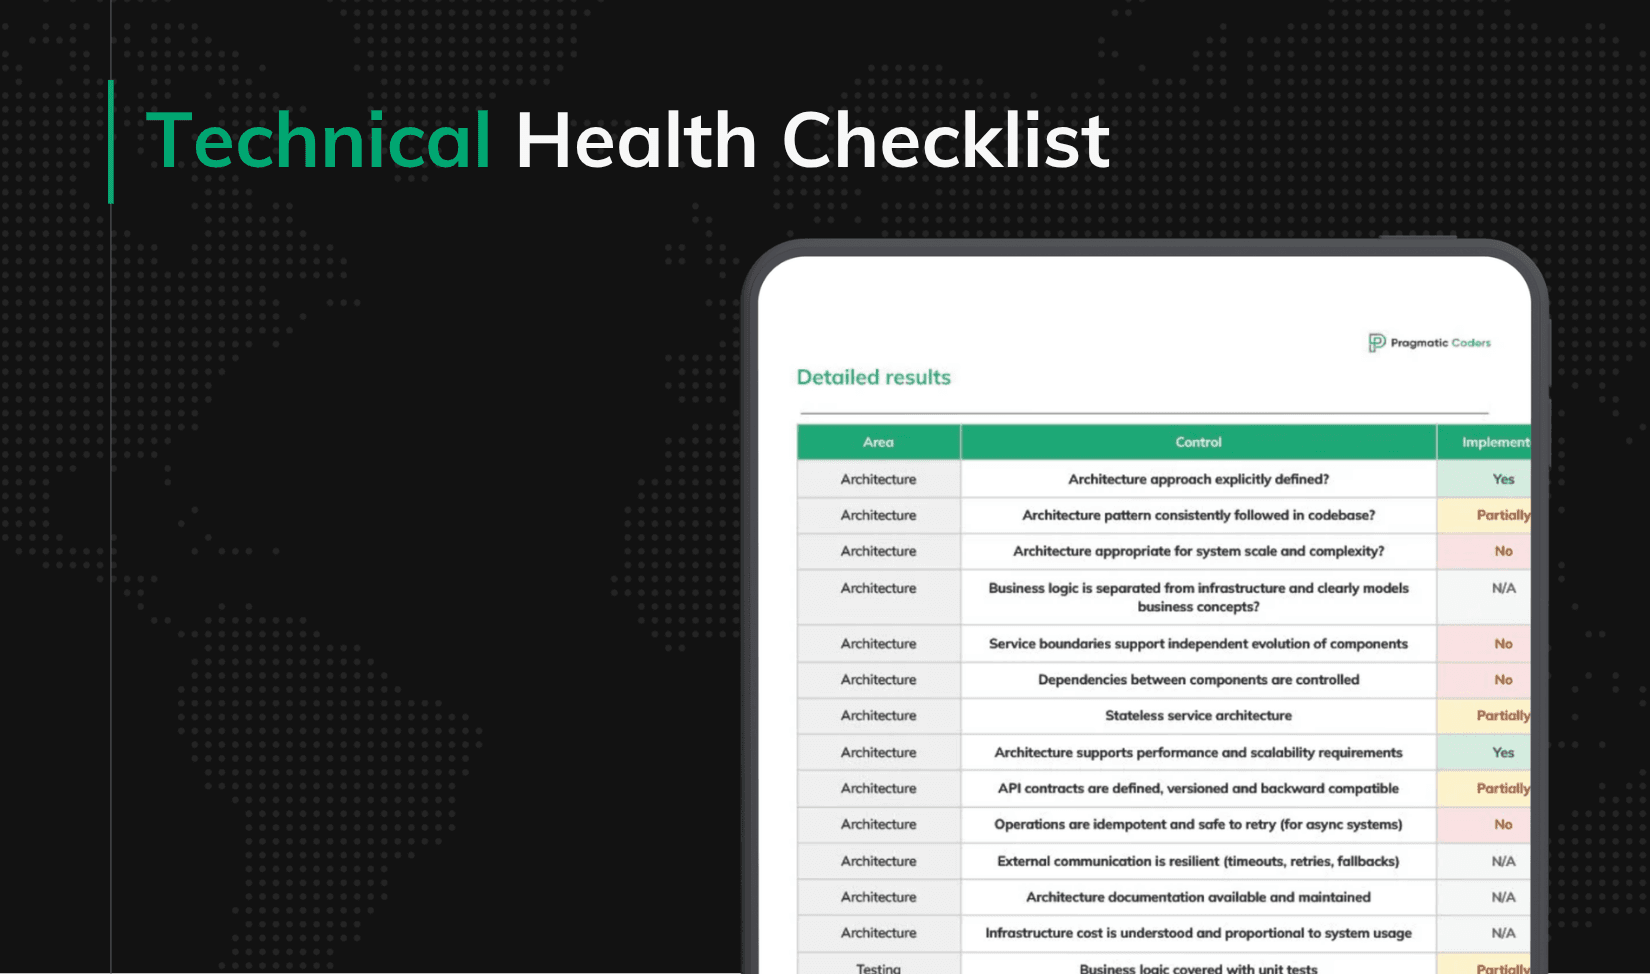
The Technical Health Checklist is a 60-item self-assessment across six areas: Architecture, Testing, CI/CD, Observability, Data and Security. Each control has a weight – from Nice to have up to Critical – a set of verification rules, and a named impact that describes exactly what fails when the control is missing.
Not all 60 carry the same signal. Sixteen of them are flagged Critical. These are controls where failure does not just slow the team down – it compounds.
Architecture
- Architecture appropriate for system scale and complexity
- Business logic is separated from infrastructure and clearly models business concepts
- Service boundaries support independent evolution of components
Testing
- Business logic covered with unit tests
CI/CD
- Automated CI pipeline builds, tests and validates code
- Automated deployment pipeline
- Infrastructure is managed as code and environments are reproducible
Observability
- Centralized logging available
- Error tracking system integrated
- Alerting configured and actionable
Data
- Database schema evolution is versioned and safely deployable
- Backup and restore strategy defined and tested
Security
- Authentication mechanism implemented
- Authorization model defined and enforced
- Secrets managed securely
- External inputs are validated and sanitized
Why these sixteen, not the other forty-four
The difference between Critical and the rest is not urgency. It is compounding damage.
When a team skips structured logging (Very important, not Critical), debugging is slower, but the pain stays inside each incident. When a team skips backup restore testing (Critical), the failure is silent for months, then catastrophic for a week. When service boundaries are wrong (Critical), every new feature bends them further, and the cost of fixing the architecture goes up every sprint, not down.
Critical controls share three properties: their failure stays invisible until it hurts, they get more expensive to fix over time, and they are rarely worked on inside a normal sprint because nothing obviously breaks when you ignore them.
That is also why they are the ones most teams skip.
What the remaining checks cover
The non-Critical controls are not less important – they are slower to cause structural damage. In brief:
Architecture adds an explicitly defined and consistently followed architecture approach, controlled dependencies free from cycles, stateless services where expected, scalability under load, versioned and backward-compatible API contracts, idempotent async operations, resilient external communication, documentation that matches reality, and infrastructure cost proportional to usage.
Testing adds integration tests against real infrastructure, end-to-end coverage of critical user flows, smoke tests after every deployment, a reproducible test environment, an explicit test data strategy, a suite the team actually trusts, and verified performance characteristics.
CI/CD adds a defined failure recovery strategy, artifact versioning, a repeatable release process across every delivered application, environment configuration managed outside code, safe deployment mechanisms like rolling updates or feature flags, automated code quality checks, and a branching strategy that supports fast integration.
Observability adds structured logs with context, backend metrics for latency, throughput and error rates, propagated trace IDs, and – possibly the most underrated control in this group – evidence that developers actually use these tools during incidents.
Data adds centralized data access, consistency strategies for multi-step operations, efficient access patterns, observability of critical changes, data lifecycle rules, and synchronization with conflict resolution for offline scenarios.
Security adds encrypted communication, compliance with applicable regulations like GDPR or HIPAA, security headers for web applications, dependency scanning, safe handling of sensitive data, audit logging, abuse protection, and periodic security reviews.
What good looks like after six months
The point of this checklist is not a single score. It is what happens when you repeat it.
Teams that run the assessment quarterly start to notice three things. First, the Critical reds turn into yellows within two or three cycles – they are almost always fixable with normal engineering capacity once they are visible. Second, the non-Critical controls become a running conversation instead of a surprise (“we are still yellow on test data strategy, but it is planned for Q2”). Third, and this is the payoff, changes that used to require three meetings start requiring one. The product slowly becomes changeable again.
A product that is changeable is, in the end, the thing the checklist measures. Everything else is instrumentation.
If you take one thing from this
Products rarely fail the way we imagine. They do not explode on a Friday afternoon. They lose their optionality quietly, one unchecked control at a time, until the team stops proposing new ideas because nobody believes they can be built in a reasonable time. The Technical Health Checklist will not fix that by itself. But it will make the decay visible – and in most rescue situations, visible is most of the battle.
Run it on your product this quarter. If more than half of your Critical controls come out as Partially or No, it is not a backlog item. It is a risk that belongs on the next steering agenda.
Run the checklist on your product. If you want help closing the gap, reach out to us.