Observability for business: how to stop hearing about outages from your customers
TL;DR
|
Every incident has three phases. Observability hits the most expensive one
Picture a typical path without observability. We deploy a change to production at 2:00 PM, and by 2:05 some user hits a problem. Within a minute most of those users simply leave for the competition or abandon the checkout flow, and only a fraction stays around long enough to even consider reporting it. By 5:00 PM there’s a support ticket waiting, but the developers are already off work and support is wrapping up for the day too. Nobody actually looks at the issue until Monday morning, and the whole report-to-fix cycle stretches over a very, very long window. Phone tag eats hours, and users have to actually want to report the bug instead of just leaving and going to a competitor.
Without observability, time to discover is measured in hours; with observability, it’s measured in minutes. We should learn about most of the common bugs within 10 minutes of deployment, not all of them, but exactly the typical ones that usually cause trouble.
So the key insight is this: observability dramatically shortens time to discover. It doesn’t speed up the fix itself, it simply means that instead of waiting hours, we know within 10 minutes that something is off. And that first phase is where you lose the most money, because as long as you don’t know there’s a problem, the problem keeps growing while you don’t even know you should be working on it.
Observability vs. monitoring. Where business misses the difference
Here’s the problem: developers and technical folks throw monitoring, alerting, and observability into one black box. The developer tells the business “I was working on observability”, the business doesn’t understand any of it and lets it go. That’s the wrong dynamic. The business should understand observability, and the business should be the one dictating what we observe.
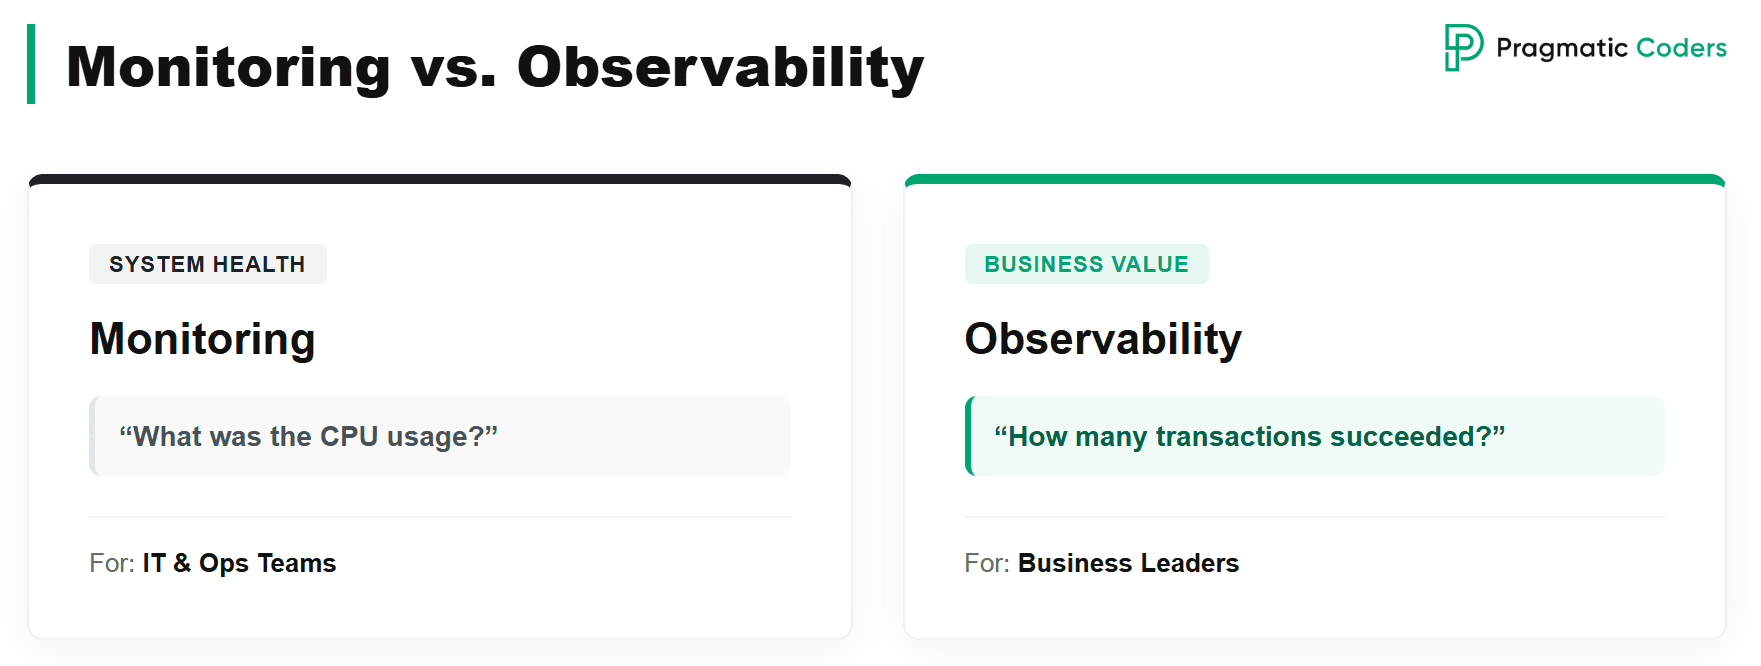
Monitoring is a different beast: purely technical. It checks CPU usage, RAM, database query rates. To put it concretely, monitoring answers questions like “what was the CPU usage?”, while observability answers “how many transactions of a given type happened in a given window, and how many of them succeeded?”. The first kind of answer is for the IT team; the second is for the business, and the second is the one you should actually want.
Five business levers. Why observability is not a developer’s toy
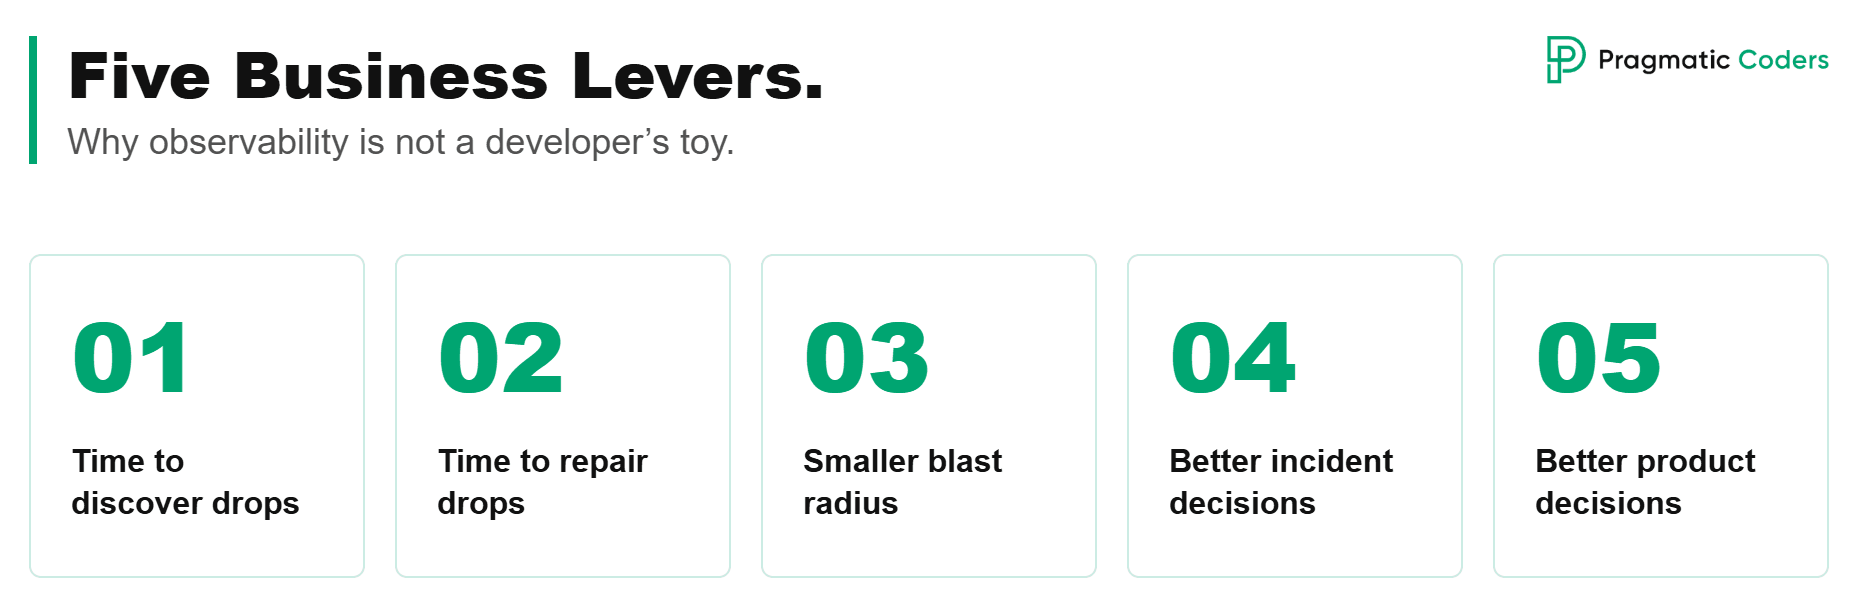
Time to discover drops
I’ve said this before, but it’s worth repeating because it’s the most important lever: alerts on user impact. Ten minutes after deployment, you already know that a user has trouble completing a purchase. Time to discover drops dramatically, and the moment you detect, you can start working on the fix.
Time to repair drops
Because the detection is automatic and rich with details, time to recovery also drops; the entry point into the task is simply higher quality. You can trace real production cases, so the question shifts from “what happened?” to “how do we fix this now?”.
Smaller blast radius
Fewer affected users, though indirectly. Observability tells you that users in a particular segment have a problem (those in Warsaw, those on Android, those on a specific subscription plan), and AI can layer on top to spot which combinations of details actually matter. Knowing exactly who’s affected lets you roll back the change for that group, or turn the feature off with a feature flag if your system is set up for it.
Better incident decisions
Sometimes the problem only affects a single customer, and in that case it’s enough to call them and say “Hey, we know it’s not working for you, we’re on it, don’t worry”. Isn’t that better than that customer calling your CEO to tell him the system is down?
Better product decisions
The same data that catches incidents also tells you whether a new feature is actually being used, in which segment, and whether shipping it broke something else. That closes the loop between “we shipped it” and “it was worth shipping”.
Case study: Orlikfy
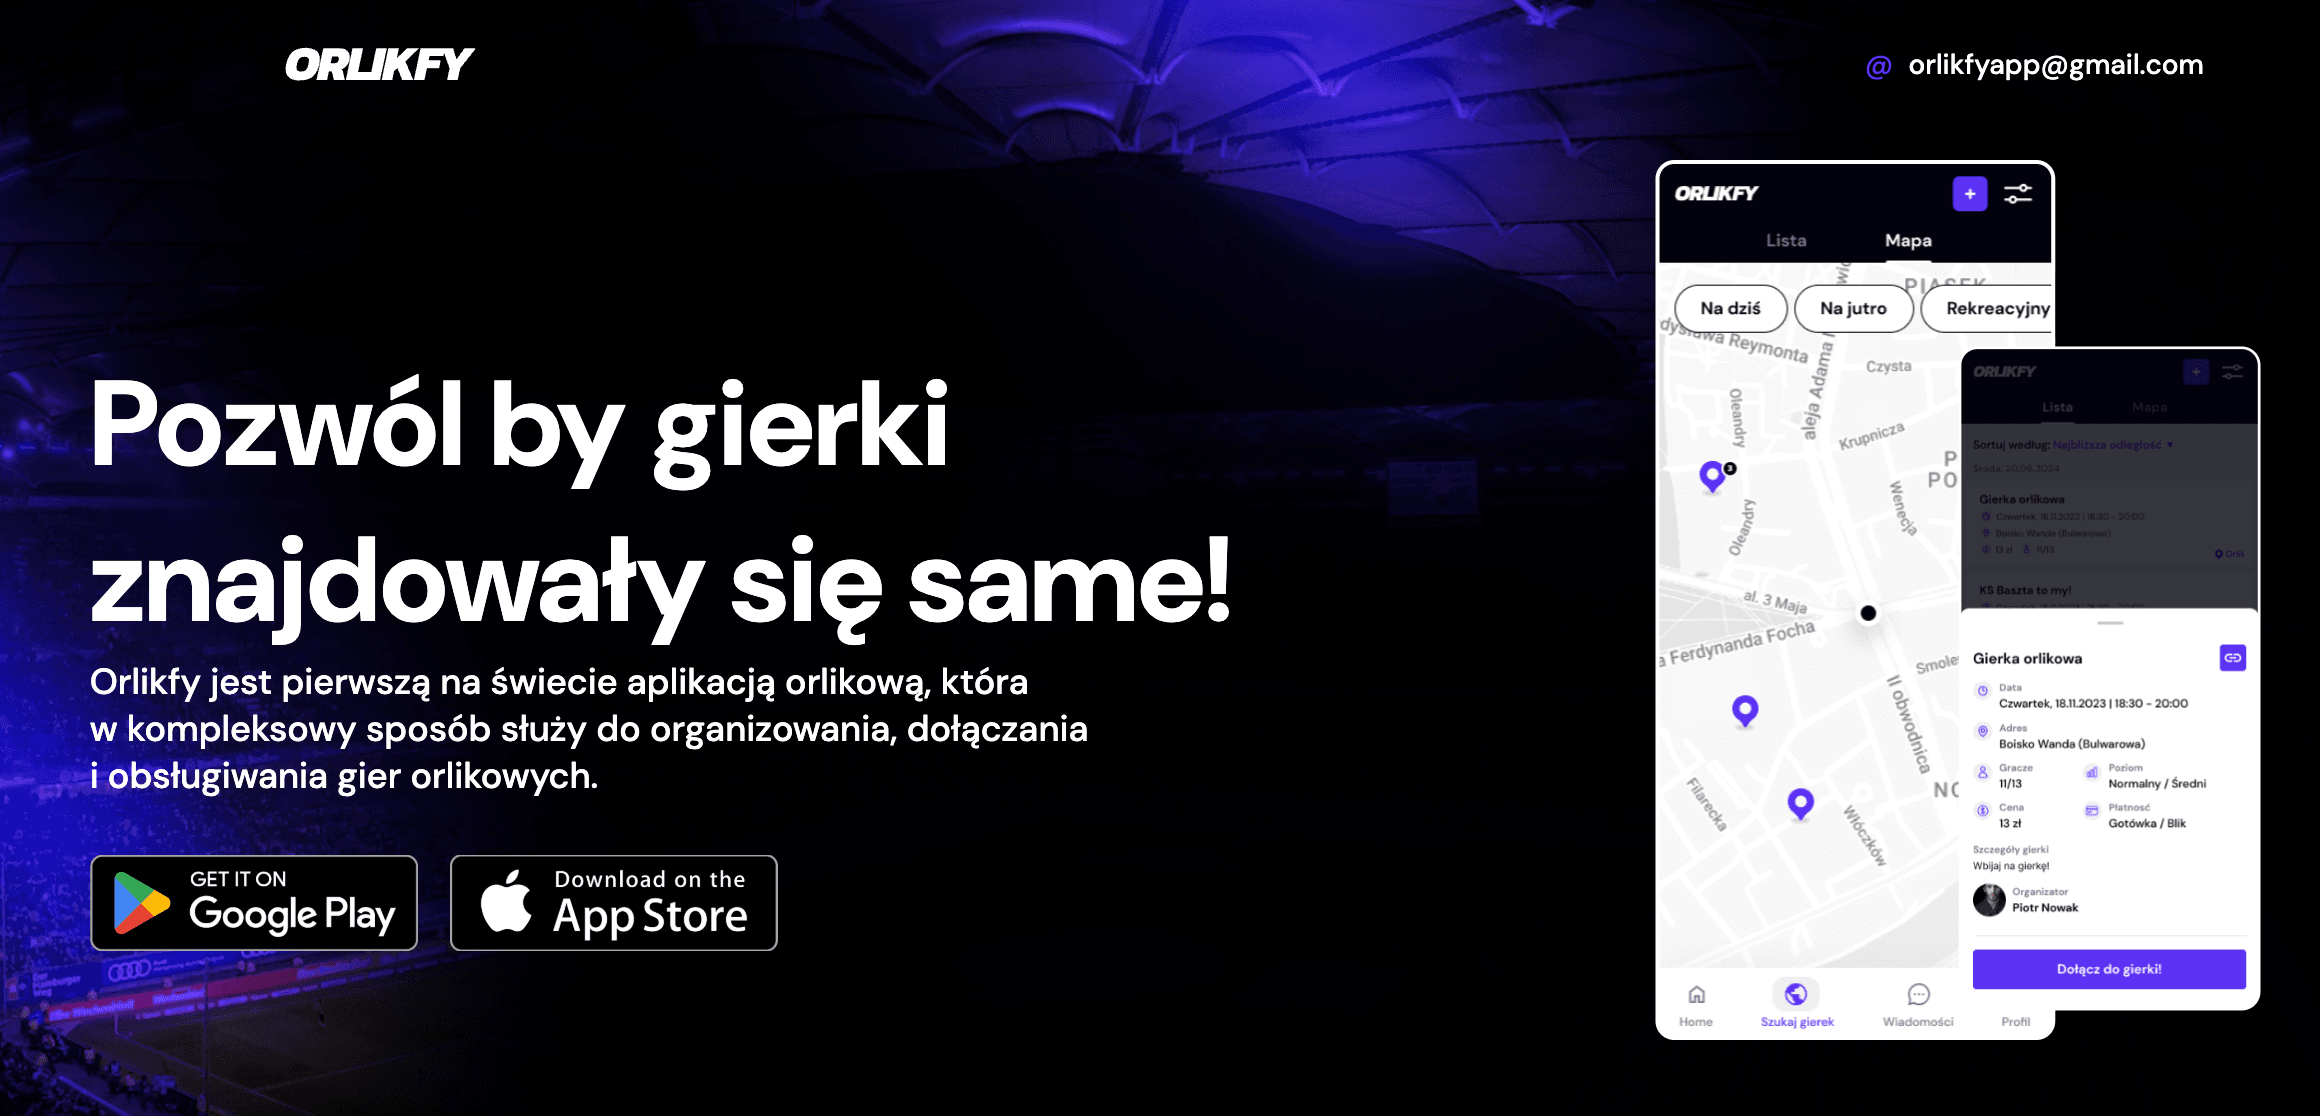
Orlikfy is the world’s first football pitch app that handles organizing, joining, and settling pickup football games end to end. In plain terms: instead of juggling thirty local Facebook groups along the lines of “Local Pitch Crew”, “Pitch Players Krakow”, or “Football Wroclaw”, you have a single app where the organizer posts a game on the map, players find it themselves and sign up with one click, and payments are tracked in one place.
This is a classic two-sided marketplace. On one side you have the organizer, the person who books the pitch, posts the event, and makes sure the squad gets filled. On the other you have the player, someone who wants to play football on Wednesday at 8:00 PM and is looking for a game to join. From a business standpoint, that means two critical user flows:
- Game creation by the organizer: posting an event on the map along with parameters like time, place, and price per person.
- Game joining by the player, including the payment, since without payment the organizer can’t cover the pitch booking.
If either of these flows breaks, the app stops delivering value in that moment. The organizer can’t post a game, so players have nothing to join; or players can’t sign up, so the organizer fails to fill the squad and ends up cancelling the event. These are exactly the processes that observability has to watch first. Everything else (chat with players, marking who paid, inviting past players to a new game) is secondary, because without a working core none of it matters.
What we observe specifically
We track the ratio of attempts to successes: how many people clicked “join the game”, and how many actually got in with a paid booking. Same for game creation: how many attempts versus how many events actually went live. Sometimes things fail for legitimate reasons (the game was already full when a player tried to join, or the bank declined the payment), and that’s fine. We have a baseline of 3-5% errors and that’s acceptable; for various reasons, some errors will always happen.
The threshold where something is wrong
What matters is the change, not the absolute number. If that level rises to 30% errors after a new release, something is clearly off. Even without a new release, if the error rate jumps by 30 percentage points within a ten-minute window, that’s still a problem. Observability tells us “Hey, something happened in this important business process” and pushes a message to the team’s Slack. Who picks it up and when is a separate topic; what matters here is that the message lands in the first place.
Weekly cyclicality, or why hard SLOs are a bad idea at the start
Here’s another thing. I’m not a fan of hard SLOs, those rigid targets like “we must stay under 1% errors”, at least not at the start. I prefer reasoning through deviation from a historical baseline, and Orlikfy is a good example of why.
In Orlikfy we see very clear weekly cyclicality, because pickup football is a deeply calendar-driven product. The most people play on Monday afternoons, while Friday afternoons are the quietest, since people are heading out for the evening, visiting family, or leaving for the weekend. Now, if I see 100 newly created games on a Friday between 5:00 and 5:10 PM, is that good or bad? Honestly, no idea. The business would love 3,000, but our reality today is 200. And if it suddenly drops to 100 on a Friday, is that bad or good? Equally unclear, especially if we just ended a marketing campaign and the drop is a natural cooldown.
The way we solved this in Orlikfy is comparison-based: when we analyze Monday at 5:00 PM, we look at how many games were created on the last three Mondays at 5:00 PM and compare. If the deviation goes more than, say, 30% in either direction, an upward swing is probably fine while a downward swing is probably not, unless we just ended a marketing campaign and we already know why. The business has to be able to make this call: is this change in the numbers good or bad? And that judgment will shift over time. If we run a campaign for three months, growth is expected; when we stop, a drop is expected too. But if we didn’t change anything and we still see games created on Monday afternoon dropping by 30%, that’s a signal worth investigating.
Without observability vs. with observability
Without observability, we discover the issue with a delay measured in tens of hours: change goes out at 2:00 PM, a user hits a problem at 2:05, those users walk away, by 5:00 PM we have a support ticket but the developers are gone, and only on Monday morning does anyone look at it. The whole sequence drags on forever.
With observability, we get a Slack alert 10 minutes after deployment. We immediately know which flow is broken, which user segment is affected, and which deployment kicked it off. Everything else is just detail.
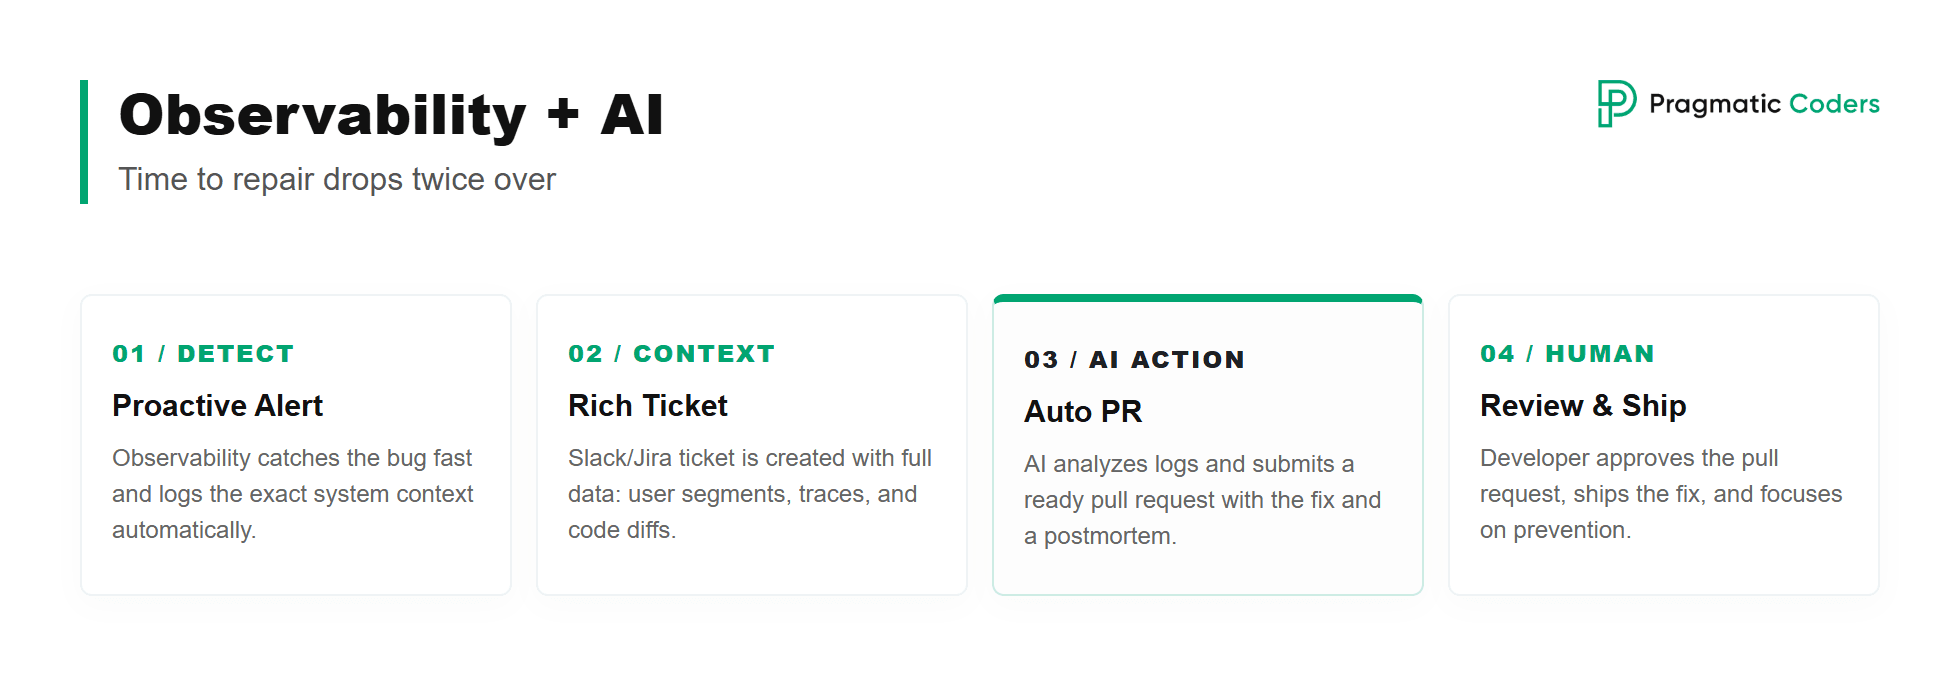
Observability + AI = time to repair drops twice over
You can’t write an article in 2026 without mentioning AI, but in this case AI genuinely earns its place.
First, observability surfaces the bug fast and creates a ticket automatically (in Jira, on Slack, wherever your workflow lives), and it does so proactively. The developer walks up to a report that already includes what, where, who, which users, and which segment. The alert carries full context: the affected user segment, a deployment trace identifying which deployment started the issue, and even a diff of what changed in the code between deployments.
There’s no need to pull more context out of memory like “if registration is broken, I have to check X, Y, and Z”. Observability bubbles it up from the logs, where we can see exactly that an error fired here and there, and both a human and an AI can pick that up and analyze it. Pair it with AI and, in an ideal world, you can start making code changes automatically: the developer comes in 30 minutes after the bug appeared and finds a ready pull request waiting, complete with a description of what happened and a postmortem of why. They accept it, ship the fix, and move on to the harder question of how to prevent this category of bug in the future.
It’s not as if observability flips the switch to self-healing on day one. You have to give the team room to roll something like this out, and it won’t happen on its own. But typical, simple bugs absolutely should become auto-fixable in this kind of setup.
How to roll this out: Observability implementation strategy
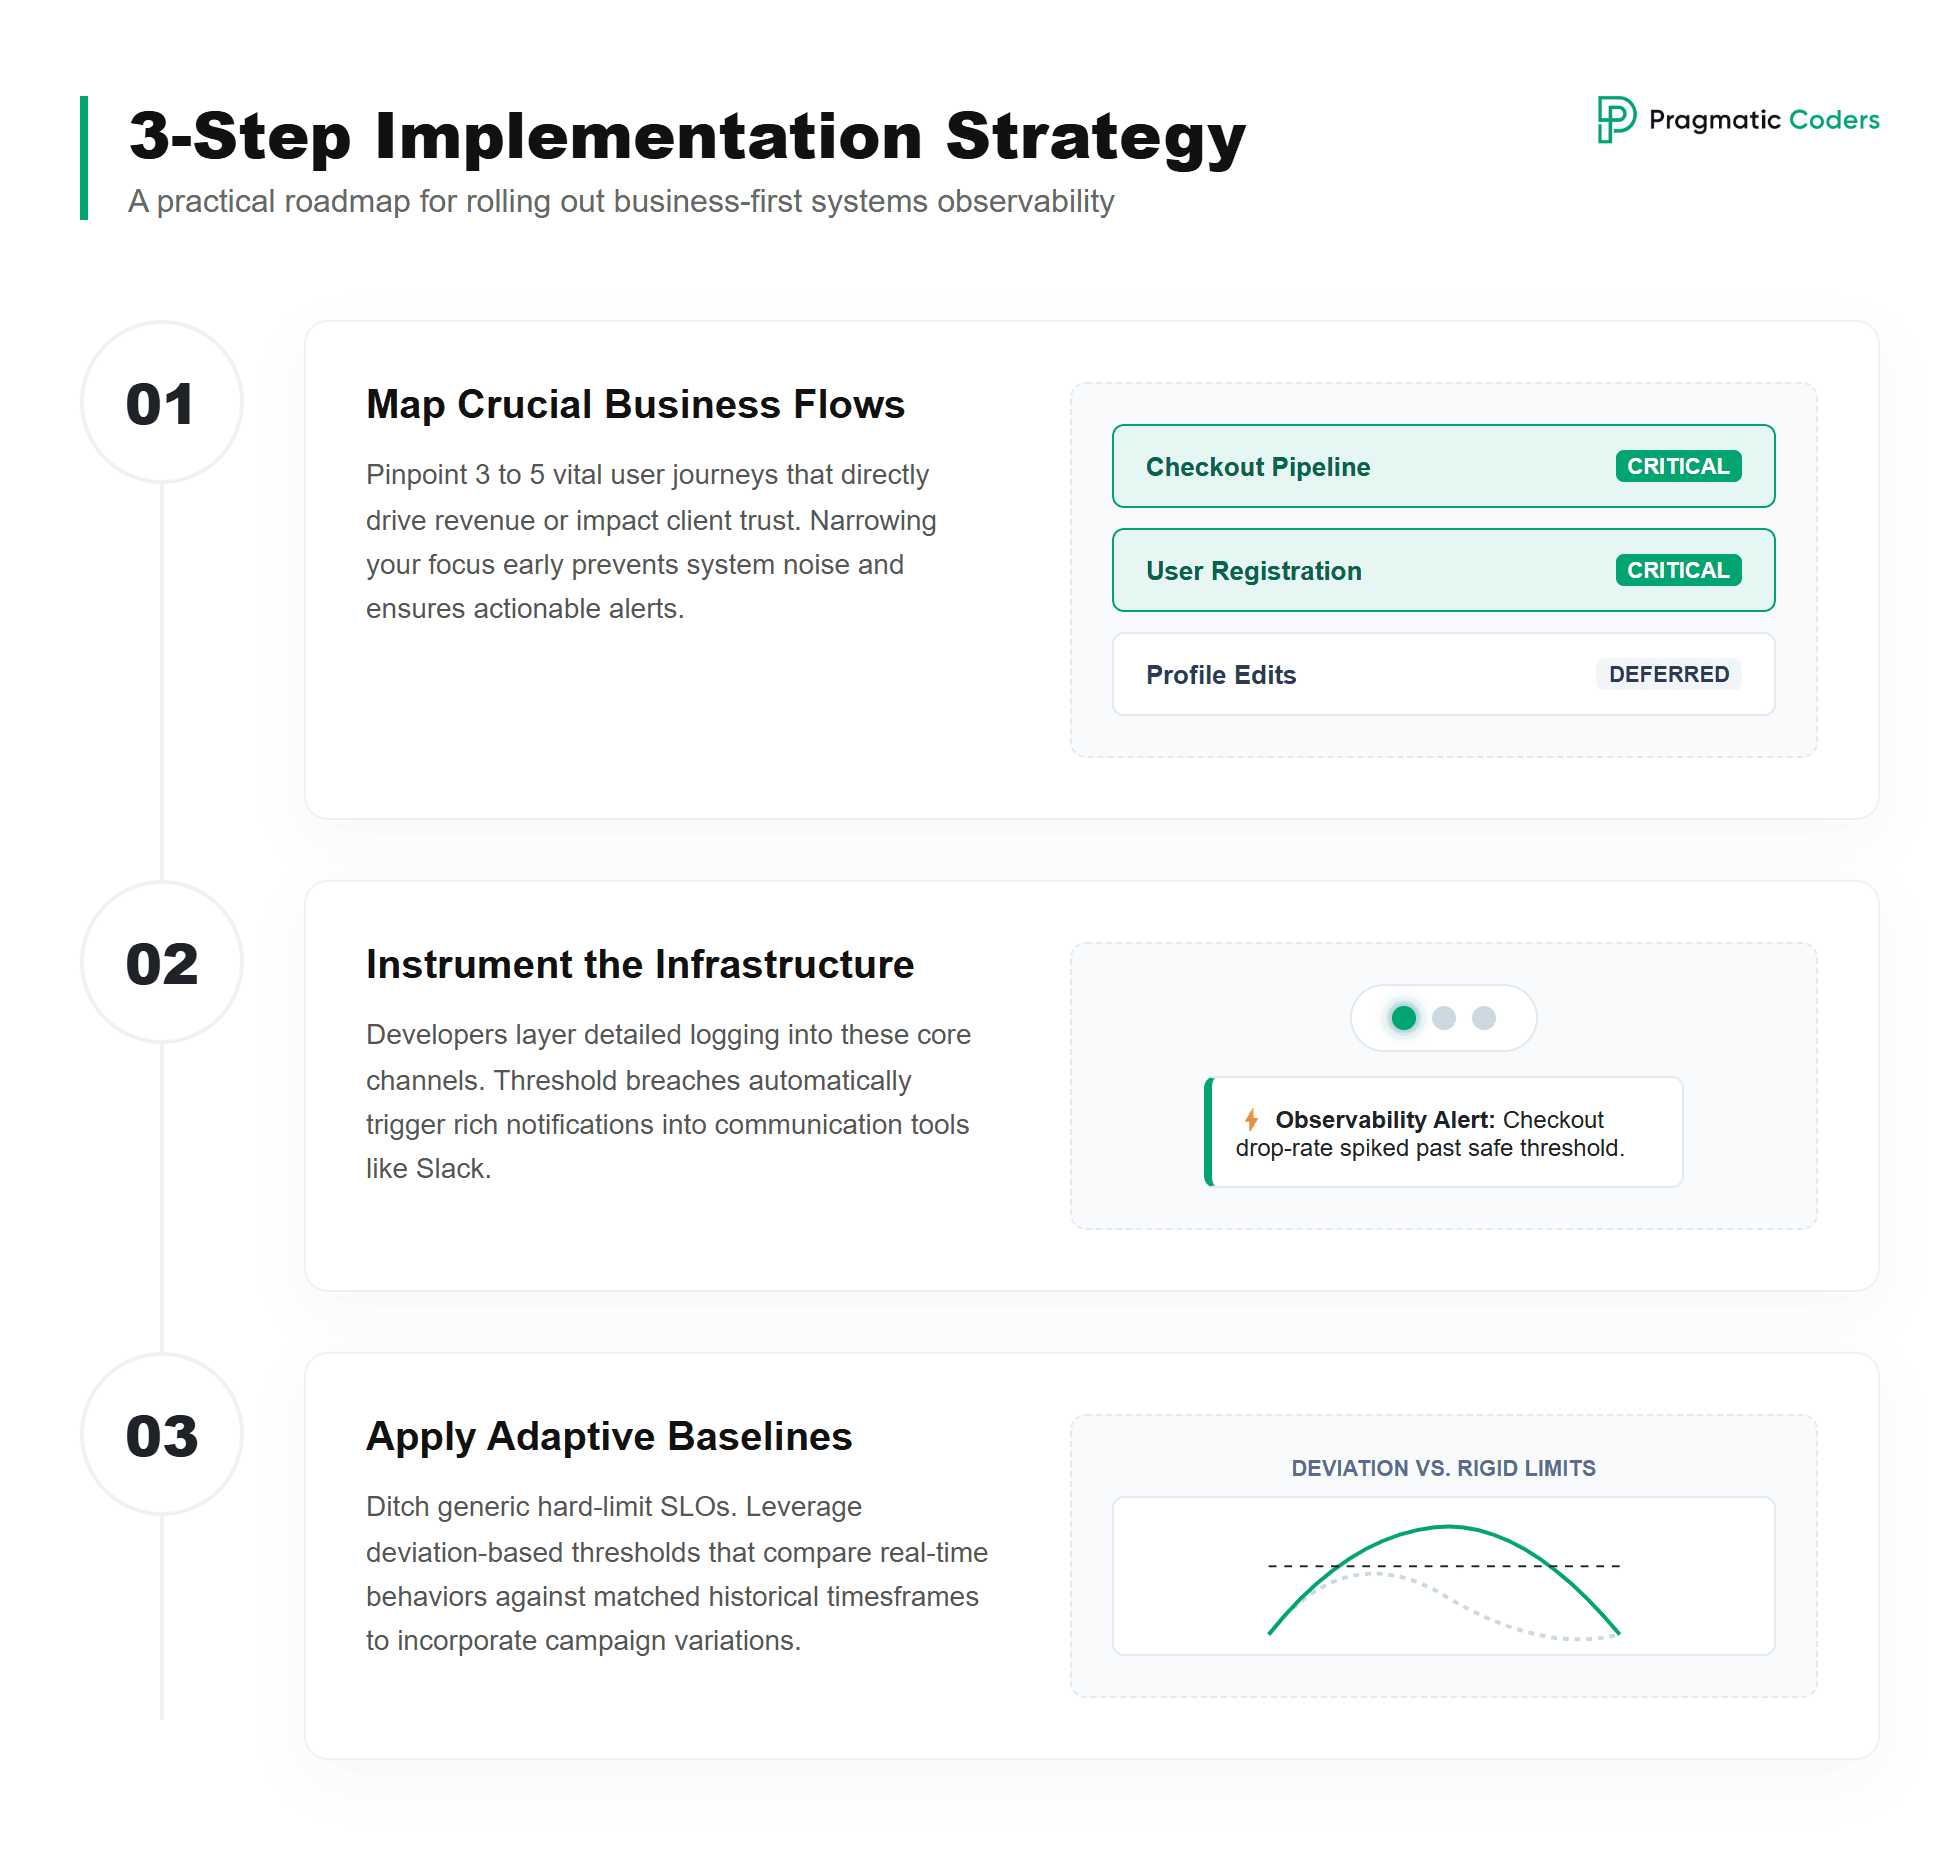
Step 1: write down 3 to 5 critical business processes
Identify the critical business processes. User journeys, endpoints, whatever you call them. Pick the ones you make money on, and the ones whose breakdown hurts the most. Three to five, no more. Don’t try to observe everything at once, or you’ll end up drowning in alert noise that nobody reads.
Step 2: instrument those processes
A developer goes in and makes those processes genuinely observable: they add the logs, set up the alerts, and wire the pipeline so that an error log firing more often than the threshold pushes a message to Slack. We leave the technical details to the team, but the business should be clear on the outcome: each chosen process has a real-time health indicator that’s actually visible.
Step 3: set the thresholds
Where do you find the “more often than X” threshold in the first place? That’s the genuinely hard part, especially when there’s no observability culture in the organization yet. Ask the business “what percentage of failed transactions do we accept?” and the gut answer will be “zero”. But in the real world, zero doesn’t exist, some errors will always happen.
This is exactly where I recommend a deviation-based approach instead of hard SLOs: compare the current value to the average from analogous periods (the same days of the week, the same hours), like the last three Mondays at 5:00 PM in the Orlikfy example. The deviation threshold is set together with the business, and you alert when it’s crossed. Seasonality and marketing campaigns are then baked right into the model.
Want a starting point? Run a self-assessment first
Before you write down those three to five critical processes and start instrumenting them, it’s worth seeing where your product actually stands today across the technical foundations that observability sits on top of: architecture, testing, CI/CD, observability itself, data, and security.
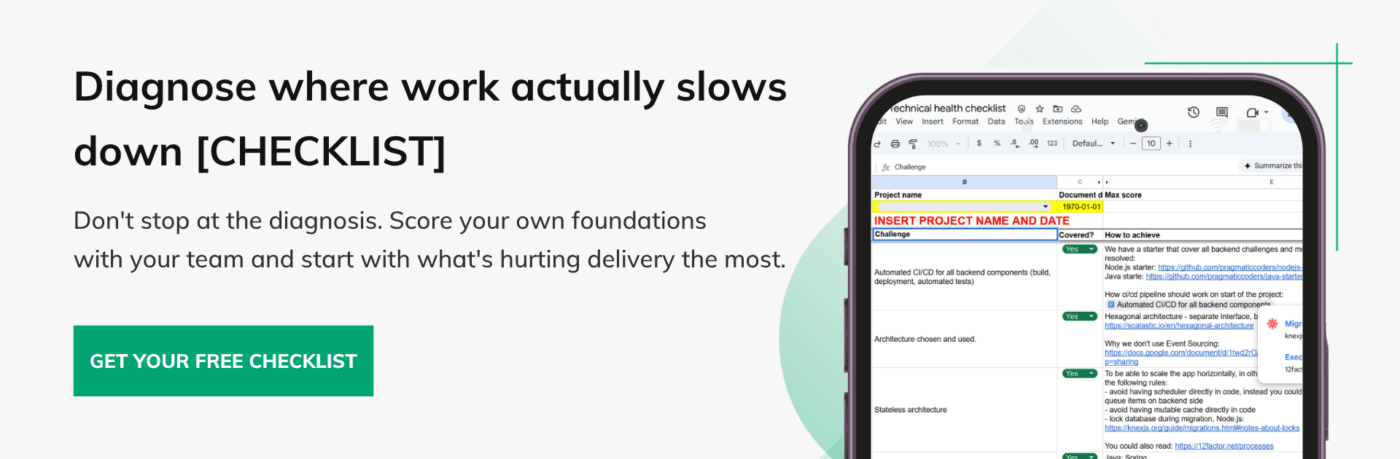
That’s exactly what our Technical Health Checklist is for. Sixty concrete checks across six areas, designed to be run by your own team in an afternoon. You mark each as Yes, Partially, No, or N/A, and the built-in dashboard scores your maturity and tells you which areas need attention first.
Get the Technical Health Checklist
The trap most companies fall into
Most companies make the same mistake. They buy Datadog or some other observability tool, and assume the problem is solved. It isn’t. A tool isn’t a practice. A tool isn’t engineering culture. A tool isn’t a sensible SDLC process. Those are three separate things, and you have to build each one deliberately.
The second trap is locking yourself into a single log provider or observability vendor. When you pick a solution, it’s worth thinking about how easily you’d be able to swap it out later, because no single vendor will always fit every context your company finds itself in a year or two from now.
Observability culture through Definition of Ready and Definition of Done
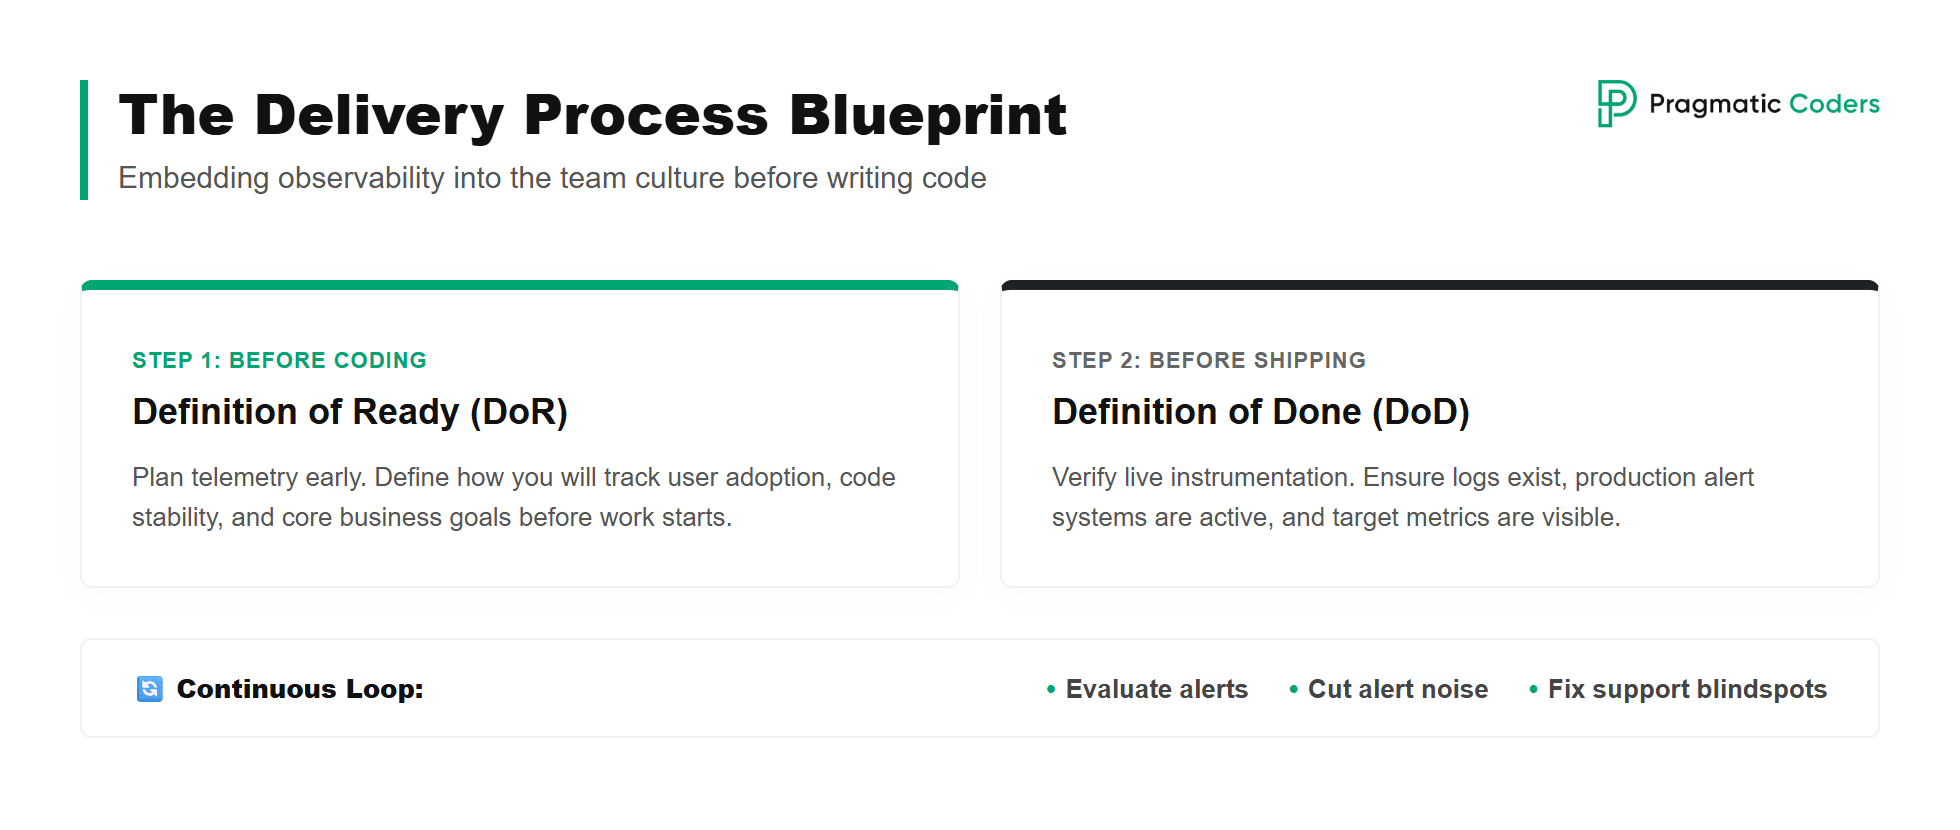
Rolling out a tool isn’t enough on its own. In my opinion, the only working way to make observability part of the culture is to wire it into the standard delivery process. To do that, you need two artefacts in place: Definition of Ready and Definition of Done.
Definition of Ready says when a task is ready for the IT team to start working on it; Definition of Done says when it’s finished. It isn’t enough to add observability only at the Definition of Done stage. You have to add it one step earlier, at Definition of Ready.
Concretely, when you’re discussing a new feature with the business, before any code is written, you should already be asking: how will we observe in the logs whether users are actually using this, whether the change broke something else, and whether the business goal is hit? Asking those questions this early lets you understand what you’re really doing, because you’ll already know how you’re going to measure it. You’ll also react to bugs faster, because you’ve already discussed how they would surface.
From there, it becomes a continuous process: you react to alerts, discuss whether they were helpful, cut down the noise when there’s too much of it, and add new observability whenever an incident comes through support that you should have caught earlier. You review and refine, and observability becomes one of the key elements of every change you make to the system.
A one-liner to remember
It isn’t about the system never going down. It’s about being the first to know when it’s down, knowing exactly who it affects, and fixing it before the user writes a “1-star, doesn’t work, uninstalling” review.
Observability dramatically reduces the cost of a production incident. The biggest impact is on time to discover, but time to repair shrinks too, especially when paired with AI. And on top of that, by managing the change well, you can also shrink the number of affected users along the way, though that’s more of a side benefit than the headline.
Not sure where observability stands in your organization? Or maybe you can see that IT keeps saying “we have Datadog”, but alerts on real business incidents still don’t reach you? Contact us for an audit. We’ll help you map the critical user journeys, design the business metrics that matter, and roll observability out so it plugs into your existing delivery process instead of becoming yet another developer’s toy.