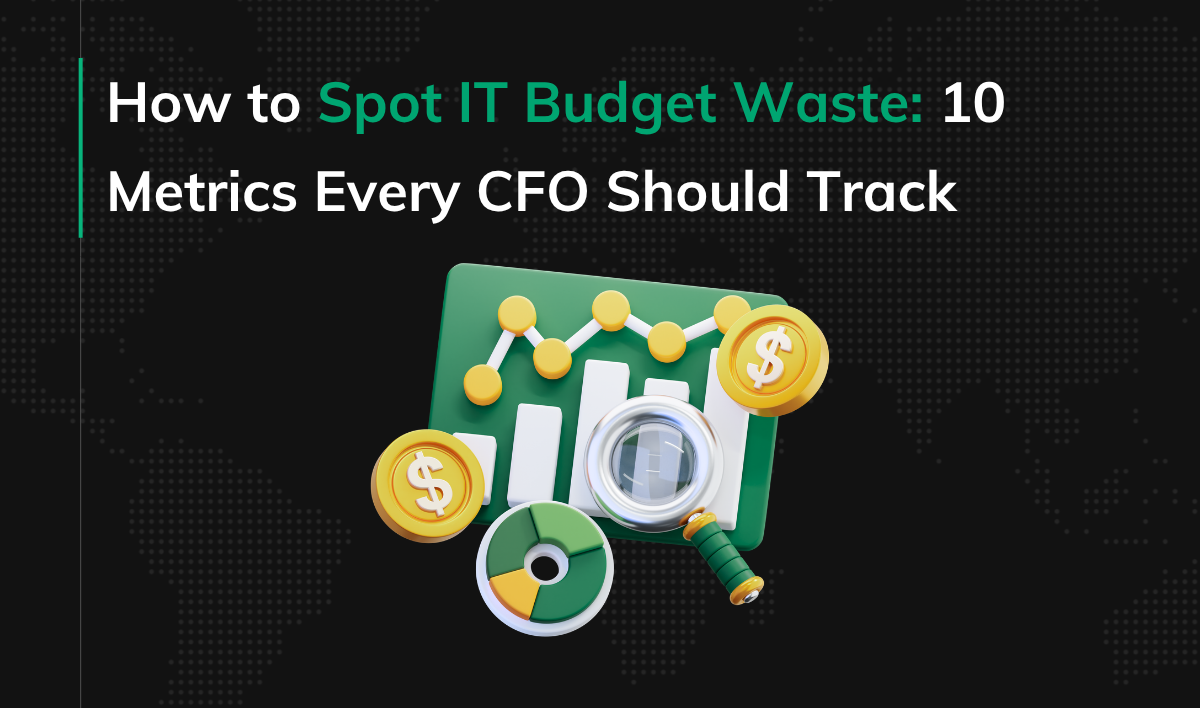
How to Spot IT Budget Waste: 10 Metrics Every CFO Should Track
You’re reviewing last month’s IT spend. The department overshot its budget again. The cloud bill is staggering, and team costs continue to climb. You ask your IT director why, and the response comes back: “we’re scaling infrastructure for new customers,” “we’re paying down tech debt to prevent system crashes,” “we’re developing a new module to boost sales.” Each of these answers makes sense on its own. But how can you be sure it’s a strategic investment, rather than an increasingly expensive way to simply keep the lights on?
This article provides a simple answer: the metrics you should track and how to interpret them.
Key Points
|
The CFO Dashboard: 10 Key IT Metrics to Track
You are already highly familiar with your technology cost structure, where cloud hosting, team payroll, and licensing fees are standard line items in your budget reports. The real challenge, however, lies in translating those costs into business value. Because the reports you receive from IT are typically purely descriptive (“this quarter we shipped X, fixed Y, and we’re planning Z”), assessing whether these outlays are actually driving business growth or merely financing an increasingly expensive status quo becomes nearly impossible.
The table below outlines ten critical metrics worth tracking. Each one maps to a common area where IT departments tend to waste capital.
| Area | Metric | What It Reveals |
|---|---|---|
| Cost | IT spend as % of revenue | Whether IT spending is aligned with overall business scale |
| Efficiency | IT cost per transaction or customer | Whether unit IT costs decrease as the business scales |
| Structure | Run / Grow / Transform | Whether the budget is funding basic maintenance, scaling, or core innovation |
| Value | Benefit realization on IT projects | Whether tech investments are actually delivering on projected returns |
| Projects | Cost of delay | The weekly financial hit of delayed software rollouts |
| Cloud | Cloud cost per customer or product | Whether cloud infrastructure scales cost-effectively alongside growth |
| Licenses | % of unused licenses | Quick-win opportunities to claw back wasted spend |
| Risk | Downtime cost and MTTR (mean time to repair) | Whether cutting maintenance overhead is quietly driving up outage costs |
| Security | Time to patch critical vulnerabilities | Your window of exposure to compounding cybersecurity risk |
| Portfolio | App cost vs actual usage | Opportunities to retire, consolidate, or simplify software |
5 Critical IT Financial Metrics for CFOs
IT Spend as % of Revenue
This baseline metric captures the scale of your technology spending by showing the exact share of company revenue allocated to IT.
Industry benchmarks vary dramatically. According to sector data, financial services firms typically spend between 4.4% and 11.4% of revenue (representing the 25th and 75th percentiles). In contrast, manufacturing companies allocate just 1.4% to 3.2%.
However, a static snapshot of this number offers limited utility; the real value lies in how this ratio trends over time, a concept we will analyze in detail below. If your organization’s baseline deviates from industry averages, it isn’t automatically a sign of trouble. It is, however, an excellent catalyst for asking your technology leadership a critical question: “What are we actually building, and why is it so expensive?”
IT Cost per Transaction or Customer
This metric tracks IT spending efficiency relative to a specific business driver. The exact unit of measure depends entirely on your business model. Typical examples include:
- Per transaction in banking,
- Per active user in a SaaS model,
- Per fulfilled order in e-commerce,
- Per system user (employee) in professional services.
As the business scales, this unit cost should trend steadily downward. If this metric remains flat despite rising transaction volumes or customer growth, you are failing to capture economies of scale. If it climbs, you are facing a severe structural bottleneck, usually rooted in flawed system architecture.
Implementing this metric requires establishing clear, upfront cost-allocation rules with your IT department. That is why it rarely appears in standard dashboards. However, establishing these parameters is vital; without them, a realistic audit of IT efficiency is virtually impossible.
IT Budget Structure: Run / Grow / Transform
Popularized by Gartner, the Run, Grow, Transform (RGT) model is a cornerstone of strategic IT financial planning. It categorizes technology spending into three distinct buckets, each aligning with a fundamentally different business objective:
- Run (maintenance): The baseline resources required to keep existing systems operational, stable, and secure day-to-day (frequently referred to as MOOSE: Maintain and Operate the Organization, Systems, and Equipment).
- Grow (growth): Expenses dedicated to scaling the business, expanding capacity, and driving efficiency gains (e.g., scaling systems to accommodate a larger customer base or introducing supplementary modules).
- Transform (innovation): Strategic investments aimed at entering new markets, launching innovative products, or deploying disruptive technologies (e.g., creating new digital touchpoints or implementing AI-powered automation).
On average, organizations allocate a staggering 65% of their IT budgets to the Run category alone. The larger this baseline maintenance bucket grows, the less capital remains to fund growth and innovation. However, a static snapshot of this allocation is insufficient; what truly matters is the trajectory of how this distribution shifts over time. Crucially, if your IT leadership cannot cleanly categorize costs across these three pillars, it is a clear indicator that technology spending is not being viewed through the lens of business value and return on investment.
Benefit Realization on IT Projects
Every corporate-funded IT initiative must be backed by a robust business case. This requires defining specific, quantifiable target outcomes, such as conversion rates, customer retention, processing speed, or labor hours saved. Auditing benefit realization means rigorously comparing these initial projections against actual post-rollout performance.
Yet, a surprising number of organizations fail to track this metric entirely. This oversight leaves a critical question unanswered: “Are our technology investments actually delivering a positive return?” This question is vital, because two companies with identical IT budgets can yield radically different business outcomes. Consider two scenarios. One company deploys projects that deliver a 3x return. The other simply marks them “completed on time” and never audits the subsequent business impact. The former compounds enterprise value; the latter quietly burns capital. Without robust benefit realization data, it is impossible to distinguish between the two.
Cloud Cost per Customer
For cloud-reliant organizations, monthly bills from AWS, Azure, or GCP are typically the most volatile and unpredictable line items in the IT budget; in fact, a single cloud invoice can easily exceed the cost of running your entire engineering team.
Yet, the aggregate cost on that monthly invoice offers very little operational visibility. Real financial clarity emerges only when you map cloud spend to a core business driver, such as a customer or product. In a well-architected platform, unit hosting costs should trend downward as you scale; if they are climbing instead, your system architecture is failing to scale cost-effectively, meaning every new contract is quietly eating into your gross margins. This remains a classic financial trap for growing enterprises. Once you’ve spotted the waste, see how to reduce software development costs and bring your cloud bill under control.
5 Secondary IT Metrics for Operational Warning Signs
The other five metrics from our dashboard serve as immediate warning signs. Each speaks for itself, requiring only a single data point to flag a high-priority issue:
- Cost of delay: Estimates the financial loss incurred for every week a rollout slips, factoring in lost revenue or unrealized operational savings.
- Percentage of unused licenses: Identifies paid software subscriptions (e.g., Microsoft 365, Salesforce, Jira) without active users. Every dormant seat is a direct budget leak that can be plugged instantly through a quick audit.
- Downtime cost and MTTR (mean time to repair): Quantifies the financial fallout of system outages and tracks restoration speed. This serves as a vital counterweight to “Run” cost optimization, exposing whether infrastructure savings are quietly triggering far more expensive failures. For the mechanism behind that bill, see where technology creates financial risk, starting with outages whose cost starts when they happen, not when you detect them.
- Time to patch critical vulnerabilities: Measures how quickly your IT team closes exposed security gaps; every week of delay leaves the door wide open to cyberattacks.
- Application cost vs. actual adoption: Matches software expenditure against actual user activity (e.g., via login data). This surfaces redundant or underutilized platforms ripe for decommissioning, consolidation, or renegotiation.
How to Analyze IT Metrics for True Cost Control
If your IT director reports a 30% year-over-year jump in cloud costs, is that cause for concern?
Such raw figures are highly misleading on their own. If your customer base expanded by 50% over the same period while unit hosting costs declined, you have achieved a textbook economy of scale. But if active users remain flat while cloud spend surges by 30%, you are looking at a glaring red flag that warrants immediate questions.
Tracking any metric in isolation is a strategic dead end. True financial visibility comes only when you connect related indicators and watch how they move together over time. To get started, focus on these three metric clusters:
Is IT Scaling with the Business?
IT Cost per Transaction × Number of Customers × Revenue Trend
This cluster reveals whether business expansion yields greater operational efficiency, specifically whether customer scaling drives down unit IT overhead.
Synthesizing these three metrics exposes your scaling trajectory. If customer headcount and revenue are both rising while unit IT costs decline, you have clear proof of healthy, sustainable scaling. The system architecture is scaling cost-effectively, spreading fixed infrastructure and organizational overhead across a larger base. However, if customer headcount and revenue grow but your IT cost per transaction remains flat, technology is scaling linearly. Each new customer introduces the same marginal IT cost, failing to unlock economies of scale. In practice, this means scaling up does not expand your gross margins, leaving you vulnerable to a competitor with a more efficient architecture who can undercut your prices while retaining superior profitability. The worst-case scenario occurs when customer headcount and revenue stagnate while unit IT costs climb. Here, economies of scale are non-existent; technology is simply cannibalizing your operational budget without delivering any business value.
Is IT Actually Delivering Value?
Run / Grow / Transform × Benefit Realization on IT Projects × Revenue Trend
This is the most critical group of all, answering the ultimate financial question: is your IT budget driving the business forward, or merely keeping it alive?
This comparison decouples legitimate operational overhead from structural waste. If the “Run” allocation steadily climbs at the expense of “Grow” and “Transform,” you are sinking more and more capital into day-to-day maintenance. This isn’t necessarily a failure; mature enterprises burdened by a large base of older, business-critical legacy systems often operate under this model for years. However, whether this represents a safe plateau or a slow-motion decline depends entirely on the other two metrics. If rising Run expenses coincide with declining benefit realization on new projects and flatlined revenues, you have definitive proof of a capital-destroying technology sink. Conversely, if both project benefits and top-line revenues are expanding, your technology engine is delivering strong operational leverage, despite the high cost of maintenance.
Is the Cloud Scaling Efficiently, or Quietly Eroding Margins?
Cloud Cost per Customer × Number of Customers × Run / Grow / Transform
Cloud billing is a unique domain where economies of scale should be exceptionally visible. A classic trap in subscription (SaaS) businesses is accepting the myth that cloud costs must scale 1:1 with customer growth. In reality, linear cloud cost scaling is an architectural design flaw, not a business necessity.
Synthesizing these three metrics allows you to diagnose not just if the cloud is eroding your margins, but why, completely bypassing the need for defensive debates with your IT leadership. Simply plot your performance data against this diagnostic matrix:
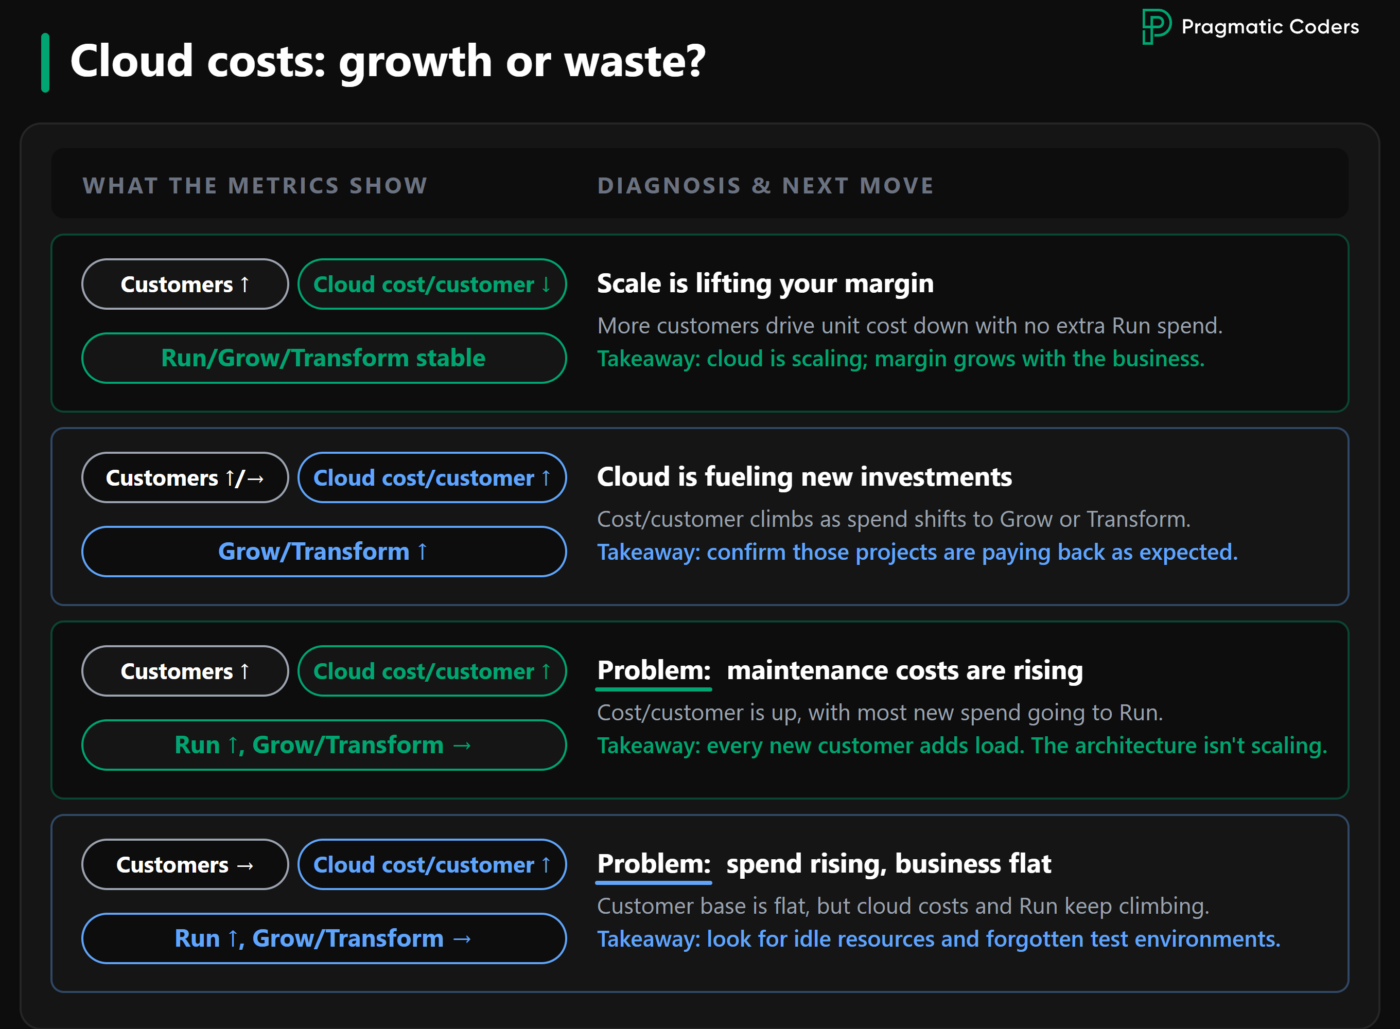
This matrix gives you absolute transparency over cloud spend. You can immediately identify whether cost increases are driven by growth, strategic investments, or pure waste. With these insights, you can stop asking vague questions about rising bills and start handing IT a specific, data-backed hypothesis to verify.
Conclusion: Mastering Your IT Cost Control
No single metric can prove whether your IT department is spending money effectively. You only get a reliable picture when you track key indicators over time and tie them directly to business outcomes, as demonstrated by the three clusters above. This approach allows you to move past gut-feel decisions and start managing based on hard facts. That is the fundamental difference between a vague suspicion that “the budget is growing too fast” and a precise, actionable diagnosis: “our maintenance costs are ballooning because our system architecture is failing to scale alongside our business.”