Why your IT project has no ROI (yet)
You’ve spent months shipping features, yet you can’t answer the one question that matters: “What did we actually get for this?“
You are stuck in the output trap – shipping code instead of value. This guide provides a pragmatic framework to stop the waste, define your outcomes, and start delivering measurable ROI every two weeks.
The real reason you’re not seeing ROI: no value validation loop
ROI doesn’t magically appear after enough deployments. ROI is the result of a disciplined process: build something, measure if it moved the needle, decide whether to double down or cut your losses. Most teams skip the last two steps entirely.
We call this a value validation loop, and without it, you’re flying blind.
Output vs. outcome vs. impact
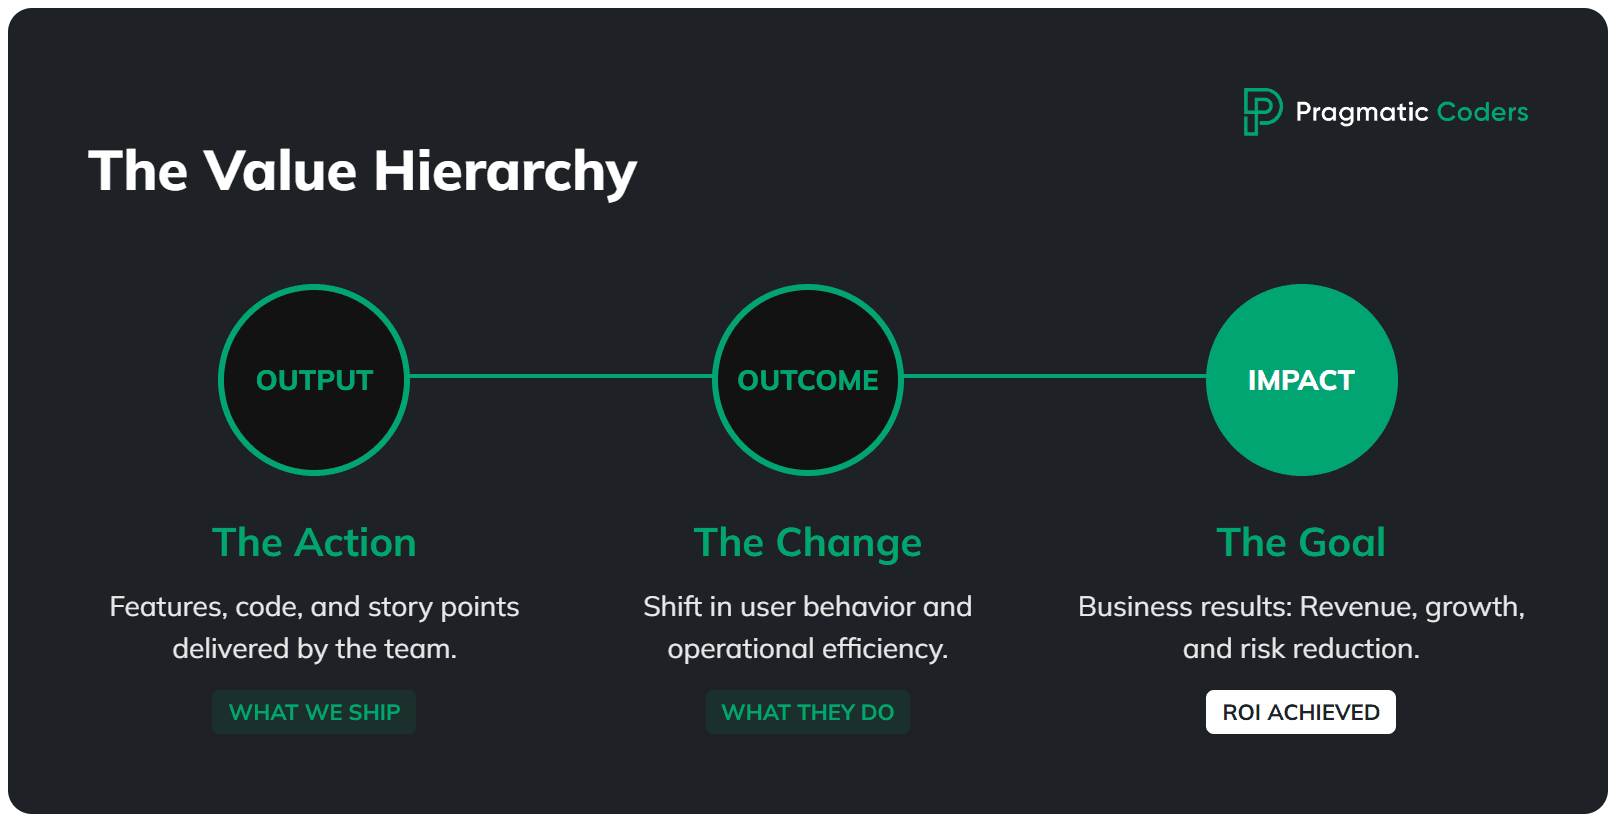
Let’s get the terminology straight, because this is where most teams get confused.
- Output is what you ship: features, story points, release notes. Your team loves tracking these because they feel productive. They’re also completely meaningless on their own.
- Outcome is the change in behavior that results from your output: users activate faster, conversion goes up, support tickets drop, cycle time shrinks.
- Impact is the business result: revenue grows, costs decrease, risk is contained, strategic goals are met. This is what your board is actually asking about.
Here’s the gap: most teams report output (“we shipped 47 stories this quarter!”) while the business expects impact (“so revenue went up, right?”). Those two worlds are separated by an ocean of unmeasured outcomes. From the CFO’s chair, that same gap looks like an IT budget that keeps growing with no visible return, which is exactly why it pays to track the metrics that show whether IT is burning money or actually delivering value.
“18 months in” as a signal
If you’re 18 months into a project and you can’t point to a clear trend in at least one outcome metric, something is structurally broken. Specifically, one of three things:
- You’re not measuring outcomes at all. No dashboard, no events, no baseline. You literally don’t know if anything is working.
- You’re building the wrong thing. The features exist, but they don’t address the actual driver of business value.
- Nobody’s handling distribution or adoption. The feature works, but nobody uses it because there’s no onboarding, no sales enablement, etc.
Quick self-diagnosis – answer yes or no:
- Do we have one metric that’s expected to move?
- Do we know how the next feature will affect that metric?
- Do we know when we’ll be able to verify it?
If you answered “no” to any of these, you’ve found your starting point.
Define “business value” in one sentence (or stop building)
Before you can prove ROI, everyone in the room needs to agree on what success looks like. Not in a vague “deliver value to the customer” way. In a single, testable sentence.
This sounds almost embarrassingly simple, and yet most project teams we’ve worked with can’t do it. They’ll point to a 30-page PRD, a Jira board with 400 tickets, or a strategy deck that references “market leadership.” None of that is a definition of success.
Outcome statement template
Here’s a template you can copy, fill in, and pin to the wall:
For [WHO] we will increase/decrease [WHAT] from [BASELINE] to [TARGET] by [DATE], measured in [SOURCE].
Real examples:
- “For new B2B trials, increase activation from 22% to 30% in 60 days, measured in Amplitude.”
- “Reduce invoice processing time from 3 days to 1 day by June 30, measured in ERP timestamps.”
If you can’t write this sentence, you don’t have a project – you have a to-do list running on hope.
Data source reality check
Here’s a trap we see constantly: teams write a beautiful outcome statement, then realize they have no way to measure it. The analytics aren’t instrumented. The CRM data is garbage. The ERP doesn’t timestamp the thing they need.
Common measurement sources worth auditing:
- Product analytics: Amplitude, GA4, Mixpanel
- CRM: HubSpot, Salesforce
- Billing: Stripe, internal invoicing
- Support: Zendesk, Intercom
- Ops: System logs, data warehouse, ERP
Diagnose which of the 5 ROI-killers you have
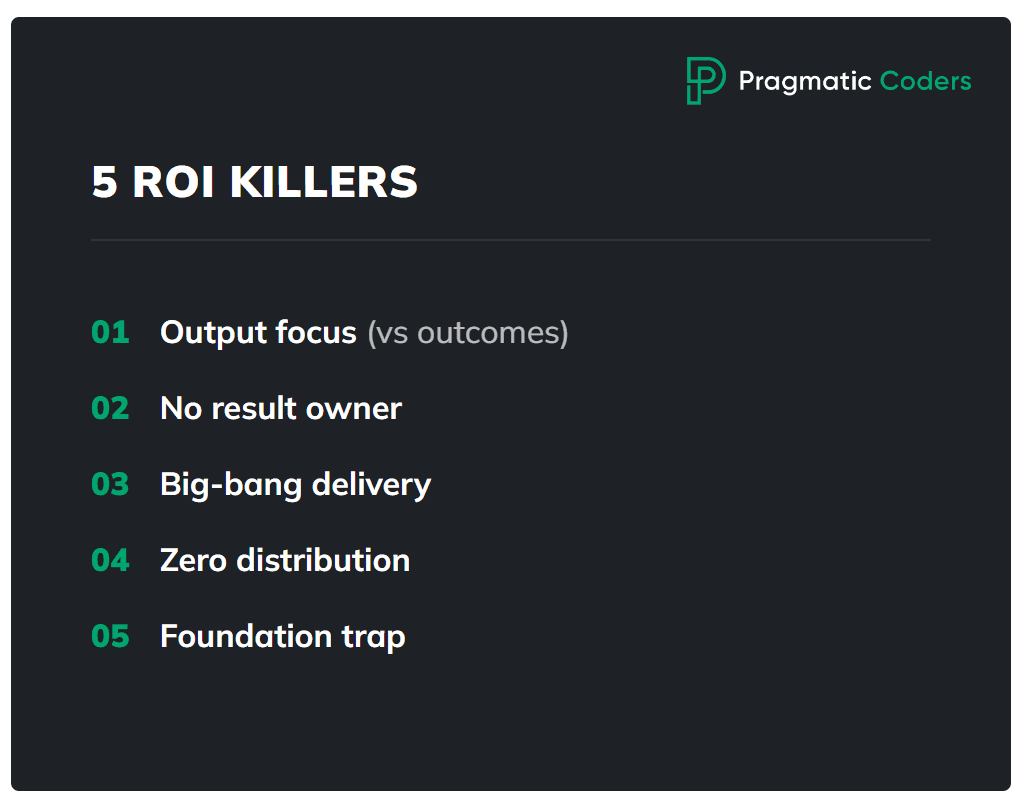
In our experience, virtually every stuck project falls into one (or more) of these five patterns. Identify yours and you’ll know exactly where to intervene.
1. Shipping output, not outcomes
Symptoms: Lots of releases. No dashboard. Nobody can tell you whether the last three features “worked.”
Why ROI is zero: Decisions are made without feedback. Cost accumulates, value doesn’t. You’re essentially gambling – except a casino at least tells you if you won.
First fix: Pick 1 outcome metric. Instrument event tracking. Run a 30-minute “impact review” every 2 weeks where you compare baseline to current.
2. No owner of the result
Symptoms: Twelve stakeholders, all of them “important.” Nobody has the authority to cut scope. Everything is priority one.
Why ROI is zero: Without a single owner who has the mandate to say stop, cut, or ship, prioritization defaults to politics, not ROI.
First fix: Designate one person as the outcome owner – with explicit authority to stop work, cut scope, and decide what ships. Not a committee. One person.
3. Big-bang delivery
Symptoms: “Once we finish module X, then it’ll all start working.” The entire value is deferred to a future launch. This approach is typical for waterfall projects = the opposite of agile.
Why ROI is zero: You’re spending the entire budget before you learn anything. By the time you discover the approach was wrong, the money’s gone.
First fix: Thin slices, end-to-end. Ship a narrow version to a small cohort, measure it, then decide. We’ll cover this in detail in the reset plan below. (But if you’re curious right now, be sure to check out our ebook How to start a startup – we described the approached in detail there.)
4. Wrong value assumption or no distribution
Symptoms: Feature is built and deployed. Usage is near zero.
Why ROI is zero: No adoption equals no impact equals no ROI. A feature nobody uses is just expensive dead code.
First fix: Run lightweight discovery. Then invest in distribution: in-app prompts, lifecycle emails, sales enablement materials. Building the feature is maybe 40% of the work. Getting people to use it is the rest.
5. The “foundations” trap
Symptoms: 12-18 months of refactoring, re-platforming, or building microservices. Zero user-facing value shipped.
Why ROI is zero: Costs keep climbing while value is permanently “coming soon.” The McKinsey data is brutal here: large IT projects over $15 million run 45% over budget and deliver 56% less value than predicted.
First fix: Set business milestones for your platform work. Minimum monetization or efficiency targets per quarter. If the foundation doesn’t enable measurable value within a bounded timeframe, it’s not a foundation – it’s a money pit.
ROI in IT projects (that you can actually use)
Most teams either don’t calculate ROI at all or get paralyzed by financial modeling. Neither is useful. Here’s a pragmatic middle ground.
Two ROI formulas you should use (and why)
Simple ROI – good for “does this even make sense?”
ROI = (Benefit – Cost) / Cost × 100%
Incremental ROI – good for prioritizing the backlog (“what gives us the most for the least?”)
Incremental ROI = Additional Benefit / Additional Cost
In plain English: if you have two items on the backlog, Incremental ROI tells you which one delivers more value per dollar spent. Here’s a quick example:
| Backlog item | Expected benefit | Cost to build | Incremental ROI |
|---|---|---|---|
| Revamped onboarding flow | +$120K/year | $30K | 4.0 |
| Full reporting dashboard | +$200K/year | $100K | 2.0 |
The dashboard looks bigger on paper, but the onboarding flow returns twice as much per dollar invested. Incremental ROI forces you to ask “what’s the cheapest way to move the metric?” instead of “what’s the biggest feature we can build?”
Use Simple ROI to justify the project to the board. Use Incremental ROI to decide what to build next. If you only ever use one formula, make it the second one – it’s the sharper tool for week-to-week decisions.
![Is your project on fire [EBOOK]](https://www.pragmaticcoders.com/wp-content/uploads/2026/02/Is-your-project-on-fire-EBOOK.png)
What counts as “benefit” (4 buckets)
Don’t overthink this. Nearly every IT project benefit falls into one of four buckets:
| Bucket | Examples | How to quantify |
|---|---|---|
| Revenue uplift | Conversion ↑, ARPA ( avg revenue per account) ↑, upsell ↑, churn ↓ | Change in metric × volume × price |
| Cost reduction | Automation, fewer tickets, less manual work | Hours saved × fully-loaded hourly rate |
| Risk reduction | Compliance, incidents, security | Probability × potential loss |
| Time/throughput | Shorter process cycles | Time saved × cost per hour × volume |
1. Revenue uplift (Selling more)
This is the most direct way to show value. You build something that either brings in new customers or makes existing ones pay more.
- Examples: Improving the signup flow (Conversion), adding a premium feature (avg revenue per account), or fixing a bug that makes people quit (Churn).
- How to calculate:
Increase in the metric×number of users×price. - Pragmatic tip: If you’re building a feature to “improve UX,” ask yourself: will this actually result in more sales, or just a prettier app?
2. Cost reduction (Spending less)
Here, you’re using technology to replace expensive manual processes or inefficient systems.
- Examples: Automating a report that used to take a human 4 hours a week, or building a self-service portal so fewer people call support.
- How to calculate:
Hours saved per month×hourly rate of the person doing the work. - Pragmatic tip: Cost reduction only counts if those saved hours are actually used for something else valuable (or if you can reduce headcount).
3. Risk reduction (Avoiding disasters)
This is essentially “insurance.” You’re building things to prevent a huge loss that might happen.
- Examples: Improving security to prevent a data breach, or updating a system to stay compliant with new laws (like GDPR).
- How to calculate:
Probability of the disaster happening (%)×the cost if it does happen. - Pragmatic tip: Don’t over-invest here unless the risk is real and the cost of failure is high.
4. Time and throughput (Moving faster)
You’re making a process faster so you can do more with the same resources.
- Examples: Speeding up the internal approval process, or making a database query run in 1 second instead of 30.
- How to calculate:
Time saved per transaction×cost of that time×total volume. - Pragmatic tip: Speed for the sake of speed is an output. Speed that allows you to process 2x more orders is an outcome.
Costs (don’t underestimate these)
Teams consistently underestimate project costs. Include:
- Team fully-loaded cost – not just salaries, but benefits, tools, office, management overhead. A senior developer often costs 1.5-2x their salary.
- Infrastructure and tools – cloud, licenses, third-party services.
- Opportunity cost – what else could this team be building? This one hurts, but ignoring it doesn’t make it go away.
- Maintenance (run cost) – every feature you ship has a permanent tax. Support, bug fixes, infrastructure.
The “good enough” approach: ranges and thresholds
Perfection is the enemy of useful ROI calculations. Use three scenarios:
- Best case: Everything works, adoption is strong.
- Base case: Realistic based on comparable data.
- Worst case: Minimum you’d expect if things stall.
Then set thresholds:
- Breakeven point: “Feature X makes sense if it improves activation by at least 3 percentage points.”
- Kill criteria: “If after 2 sprints, there’s no trend in the metric, we cut or pivot.”
This way, you don’t need a perfect forecast. You need a clear enough picture to make a decision.
What to measure when ROI isn’t in cash yet
“We can’t measure ROI because we don’t have revenue yet.” We hear this constantly, and it’s a cop-out. You can always measure leading indicators, and you can always connect them to money with a chain of logic.
Leading indicators that predict ROI
- Activation rate – are users reaching the “aha” moment?
- Time-to-value – how long until they get something useful?
- Feature adoption – first use and repeat use rates
- Retention proxy – D7 and D30 retention
- Cycle time / resolution time – for operational projects, how much faster is the process?
How to connect leading indicators to money
Draw the chain:
- Activation ↑ → trial-to-paid ↑ → revenue ↑
- Time-to-value ↓ → churn ↓ → LTV ↑
- Support tickets ↓ → support cost ↓
- Processing time ↓ → headcount reallocation → operational cost ↓
You might not have the exact numbers for each link, but even directional estimates beat “we’ll know eventually.”
Example: ROI math
Let’s walk through a hypothetical example to make this concrete.
Context: B2B SaaS company. Trial conversion is the bottleneck.
| Metric | Current | Target |
|---|---|---|
| Monthly trials | 1,000 | 1,000 (unchanged) |
| Trial-to-paid conversion | 8% | 9.2% (+1.2pp) |
| Average contract value | $5,000/year | $5,000/year |
Hypothesis: Improving activation (from 22% to 30%) through a redesigned onboarding flow and lifecycle prompts will lift trial-to-paid conversion by 1-2 percentage points.
Mechanism: Ship a thin-slice onboarding flow (week 1), add lifecycle email prompts (week 2), measure activation and trial-to-paid for 30 days.
The math:
- Current paying customers/month: 1,000 × 8% = 80
- Target paying customers/month: 1,000 × 9.2% = 92
- Delta: 12 additional customers/month
- Annual revenue uplift: 12 × $5,000 = $60,000/month = $720,000/year
- Cost of the experiment: ~2 engineers × 4 weeks = ~$40,000 fully loaded
- Simple ROI: ($720K – $40K) / $40K = 1,700%
Even in the worst case (0.5pp improvement instead of 1.2pp), that’s still 5 additional customers per month, $300K/year, and an ROI of 650%.
Decision point after 4 weeks:
- If activation reaches 28%+ → scale (expand the cohort, add channels)
- If activation is 24-27% → iterate (change onboarding steps, test new prompts)
- If activation is flat at 22% → kill (the hypothesis was wrong, move to the next lever)
That’s what pragmatic ROI management looks like.
Before you do anything else
ROI isn’t a happy ending at the tail of a roadmap. It’s a process. Metrics plus decisions plus discipline, repeated every two weeks. The framework here – outcome statement, value tree, stop-doing list, thin slices, kill criteria – isn’t revolutionary.
The hardest part isn’t the math. It’s cutting scope, confronting bad assumptions, and making someone accountable for the result. Most teams would rather ship another feature than face those conversations.
If you want, we can run the 2-4 week ROI reset with your team: define the metrics, build the value tree, create the stop-doing list, ship 2 thin slices, and establish a decision cadence. We’ve done it before. It’s not magic – it’s pragmatic.
FAQ
How do you calculate ROI for an IT project?
Use this formula: ROI = (Benefit – Cost) / Cost × 100%. The benefit can be revenue uplift, cost reduction, risk reduction, or time savings. The cost should include fully-loaded team costs, infrastructure, opportunity cost, and ongoing maintenance. For prioritizing features in the backlog, use Incremental ROI instead: Marginal Benefit / Marginal Cost. Don’t aim for precision – use best/base/worst case ranges and set clear breakeven thresholds.
Why do software projects fail to deliver business value?
Roughly 70% of IT projects fail to meet their objectives, and the root cause is rarely technical. The five most common patterns: teams ship output (features) instead of measuring outcomes (behavior changes), nobody owns the business result, value is deferred to a “big bang” launch, features get built without distribution or adoption plans, or the team spends 12-18 months on “foundations” without any user-facing value. The fix starts with defining a single outcome metric and reviewing it every two weeks.
What if ROI is hard to measure?
It almost never is – you’re probably just measuring (or trying to measure) the wrong thing. Instead of waiting for revenue data, track leading indicators: activation rate, time-to-value, feature adoption, D7/D30 retention, or cycle time reduction. Then connect them to money with a chain of logic. Activation goes up, conversion goes up, revenue goes up. Support tickets go down, support costs go down. Even directional estimates beat “we’ll know eventually.”