How to calculate the cost of tech debt (9 metrics to use)
Technical debt is like financial debt, with two costs:
- Principal – the one-time cost to fix the issue
- Interest – the ongoing cost from lost efficiency and productivity
Engineers spend 2–5 working days per month on tech debt (JetBrains, 2025); that’s up to even 25% of the engineering budget. Globally, this means tens of billions in lost capacity. Quite a lot, and it’s going to be worse because of AI.
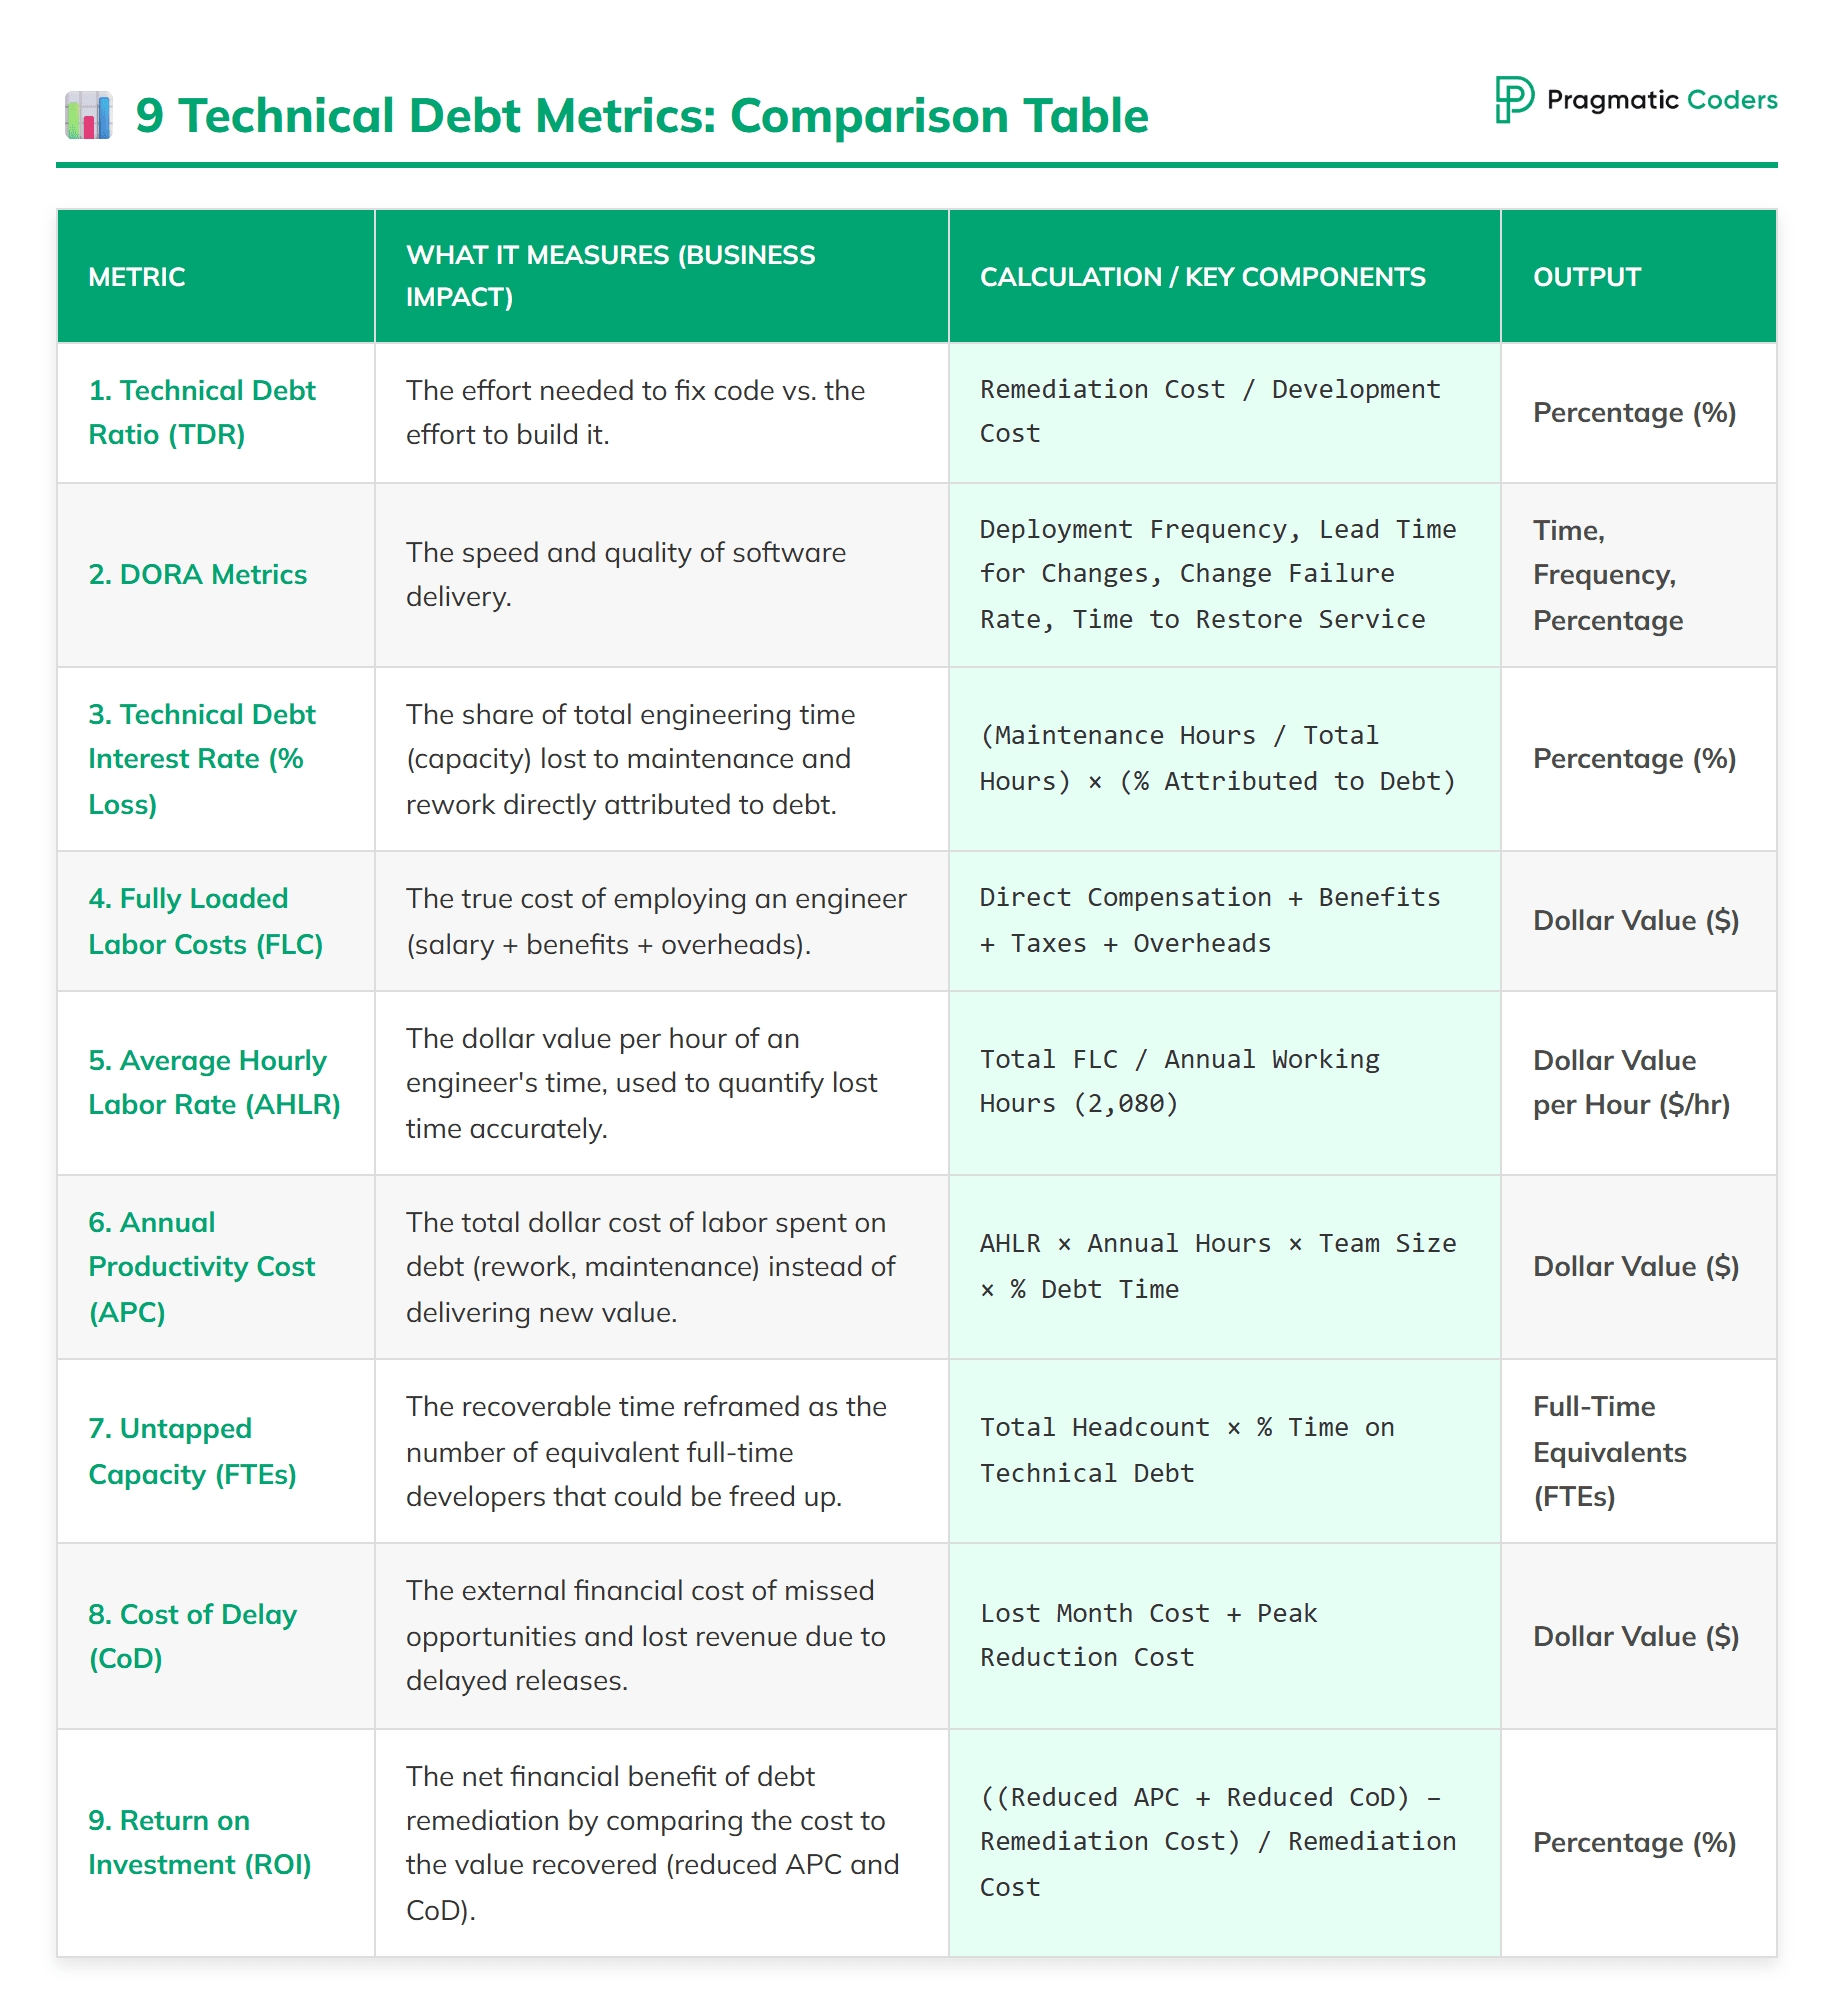
Technical debt IS a problem. In this article, we’ll go over 9 metrics that will help you calculate the cost of tech debt and voice it to the “business” in your company.
Check the types of technical debt: 16 Types of Technical Debt in FinTech | Pragmatic Coders
These metrics turn gut feelings into numbers. That matters when you talk to finance and leadership. If you also want a simple written scan of product health (beside spreadsheets), use our Product Health Checklist.

1. Technical debt ratio (TDR)
Technical Debt Ratio (TDR) measures how much work is needed to fix code issues compared to the cost of building it.
Formula:
TDR = Remediation Cost / Development Cost
Example:
If fixing issues costs $10,000 and building the code cost $100,000:
TDR = 10,000 / 100,000 = 0.1 (or 10%)
Interpretation:
| TDR Range | Severity | Interpretation | Business Impact |
| < 5% | Minimal | Code is healthy | Little to no impact on productivity |
| 5–15% | Moderate | Manageable – keep an eye on it | Slower development |
| 15–30% | Significant | High – action needed | Major productivity loss |
| 30–50% | Severe | High – action needed | High business risk |
| > 50% | Extreme | High – action needed | May require system replacement |
TDR helps leadership turn technical status into business risk they can measure. Teams tag assets like on-prem, SaaS, or FaaS with metadata, then assign a TDR to each. This makes it easier to decide where to invest.
How to calculate the remediation cost?
To calculate the development cost, you take the number of hours spent on development and multiply it by your developers’ hourly rate (or, even better, AHLR – see point 5 below). But for the remediation cost, it’s a bit more nuanced.
A solid assessment of the remediation cost combines engineering metrics with developer feedback to show the full impact of technical debt. Check these 3 areas:
- Code Analysis Tools – if you use them (e.g., SonarQube) give objective data on complexity, duplication, and other code issues.
- Project Management Tools (e.g., Jira, GitHub Issues) track tasks marked as “technical debt” or “rework” to estimate effort spent repaying debt.
- Developer Surveys
- Capture issues metrics miss, like cognitive load, poor documentation, and frequent context switching.
- Surveys should show you:
- Time lost to inefficiencies (avg. 8 hours/week)
- Time spent on maintenance (e.g., 17.3 hours mean)
- Perceived waste (e.g., 25% of work time)
- These inputs adjust and validate productivity loss figures from tools.
Together, these three sources will help you assess the amount of time spent on fixing tech debt. Then you just multiply the number of hours by your developers’ hourly rate or AHLR), and this gives you the remediation cost.
2. DORA metrics
DORA (DevOps Research and Assessment) metrics highlight the impact of technical debt by tracking:
- Deployment Frequency – How often code is released
- Lead Time for Changes (LTC) – Time from code commit to production
- Change Failure Rate – % of deployments causing failures in production
- Time to Restore Service – How fast teams recover from incidents in production
Drops in these metrics show growing friction from technical debt — and all of them translate into extra costs, whether through delayed cash flow (Cost of Delay), higher labor expenses from incident responses, or unplanned rework.
3. Technical debt interest rate (% Loss)
The clearest sign of technical debt interest is time spent on unplanned work, maintenance, and rework.
Keeping tabs on how much time goes into maintenance versus building new features helps shape the financial model. The key metric here is:
Technical Debt Interest Rate (%Loss):
The share of total engineering time used for debt-related maintenance.
Formula:
%Loss = (Maintenance Hours / Total Development Hours) × (% Attributed to Technical Debt)
Example:
If maintenance takes 40% of team time, and 50% of that is due to technical debt,
Interest Rate = 40% × 50% = 20%
The 20% shows how much of the engineering team’s total capacity is lost to technical debt instead of building new features or products.
4. Fully Loaded Labor Costs (FLC)
To estimate the real cost of productivity loss, use the Fully Loaded Cost (FLC) – not just base salary – to reflect the full expense of employing engineers.
Formula:
Total FLC = Direct Compensation + Benefits + Taxes + Overheads
This total is then used to calculate the Average Hourly Labor Rate (AHLR) for valuing lost time.
FLC Components:
- Direct Compensation: Base salary or wages
- Employee Benefits: Health insurance, PTO, retirement (adds ~20–30%)
- Payroll Taxes: Employer-paid Social Security, Medicare, etc.
- Overheads: Tools, office space, utilities, HR, recruiting, etc.
- Others
5. Average Hourly Labor Rate (AHLR)
The AHLR is the cost per hour of employing a full-time engineer, including all related expenses. It’s used to estimate the dollar value of productivity loss.
Formula:
AHLR = Total Annual Fully Loaded Cost (FLC) / Annual Working Hours
Standard working hours = 2,080/year
Example: AHLR Calculation
| Cost Component | Basis (for $120K salary) | Annual Cost (USD) |
| Base Salary | Annual compensation | $120,000 |
| Employee Benefits | 25% of base salary | $30,000 |
| Employer Payroll Taxes | 7.65% of base salary | $9,180 |
| Workers’ Compensation | 1.5% of base salary | $1,800 |
| Operational Overhead | Software, office, tools, training | $12,000 |
| Total FLC | Sum of all components | $172,980 |
| AHLR | $172,980 / 2,080 hours | $83.16/hour |
This rate gives a consistent, realistic input for modeling the cost of technical debt over time.
6. Annual Productivity Cost (APC)
APC measures how much labor cost is spent on technical debt work (like rework, maintenance, and debugging) instead of delivering new business value.
Formula:
APC = AHLR × Annual Working Hours × Team Size × % Time on Technical Debt
Scenario:
An organization has 50 developers.
Inputs:
- Average FLC per developer: $172,980
- Validated productivity loss: 25%
- Annual working hours per developer: 2,080
- AHLR (Average Hourly Labor Rate): $83.16
Steps:
- Total annual hours = 50 × 2,080 = 104,000 hours
- Wasted hours (due to tech debt) = 104,000 × 25% = 26,000 hours
- APC = 26,000 × $83.16 = $2,162,160
Conclusion:
The APC is $2.16 million per year – the direct cost of time lost to technical debt instead of creating new value.
7. Untapped Capacity (FTEs)
To make the case to the C-suite, APC is reframed as Untapped Capacity – the recoverable time lost to technical debt.
Formula:
Untapped Capacity (FTEs) = Total Headcount × % Time on Technical Debt
Example:
50 developers × 25% = 12.5 FTEs
This means fixing the debt could free up the equivalent of 12.5 full-time developers – without new hires. Framing this as a strategic investment in better use of current staff makes it more compelling than a routine maintenance request.
8. Cost of Delay (CoD)
Technical debt often delays software releases, making Cost of Delay (CoD) a key metric for understanding its external financial impact. CoD includes lost revenue, missed opportunities, and added risk from late delivery.
Total CoD = Lost Month Cost + Peak Reduction Cost
- Lost Month Cost: Revenue lost during the delay, calculated as: Average monthly profit = volume × margin
- Peak Reduction Cost: Long-term losses from launching late – lower lifetime profit, reduced market share, and fewer users.
By measuring CoD, technical debt is reframed as a competitive risk, not just an internal issue. These losses show why tech investment is needed to speed up delivery and stay competitive.
9. Return on Investment (ROI)
The remediation is worth it if the value recovered (lower APC and CoD) is greater than the cost to fix the debt.
ROI = ((Reduced APC + Reduced CoD) – Remediation Cost) / Remediation Cost
The goal is to cut time loss and boost revenue. The ROI must show that fixing the debt delivers better returns than doing nothing – with targets like a 25% gain in feature delivery efficiency.
Math can show if a fix pays off. It does not always show how stressed the team and roadmap really are. For a plain-language symptom check, read Is your project on fire? Self-diagnosis.
![Is your project on fire [EBOOK]](https://www.pragmaticcoders.com/wp-content/uploads/2026/02/Is-your-project-on-fire-EBOOK.png)
Need help with your tech debt?
Technical debt slows your entire company, not just your engineers. These nine metrics help you measure it and back up what every tech leader feels: “We’d move faster with a cleaner foundation.”
If legacy systems or hidden inefficiencies are slowing you down, we can help measure and fix them. At Pragmatic Coders, we’ve modernized software for banks, PropTechs, logistics, and crypto startups – cutting rework, automating delivery, and turning maintenance into growth.
👉 Measure your technical debt. Turn it into an advantage. Contact us at pragmaticcoders.com/contact or schedule a free consultation.

How do I prioritize which technical debts to fix first?
Prioritization comes down to impact vs. effort — balancing business value recovered against remediation effort.
Here are three practical frameworks you can use:
a. Value vs. Effort Matrix
Plot each debt item on a 2×2 grid:
- High Value / Low Effort: fix immediately — these are “quick wins.”
- High Value / High Effort: plan strategically; these are major enablers.
- Low Value / Low Effort: fix opportunistically during refactors.
- Low Value / High Effort: defer or retire.
b. ROI-Based Ranking
Use the ROI formula:
ROI = ((Reduced APC + Reduced CoD) – Remediation Cost) / Remediation Cost
Rank items by descending ROI to focus on the highest returns first.
c. Risk-Based Scoring
If quantifying ROI is hard, use a risk-weighted scoring model:
- Business impact (1–5)
- Frequency (1–5)
- Visibility (1–5)
- Remediation complexity (1–5)
Total the scores and rank accordingly.
This approach helps justify priorities with data executives understand.
How do I present technical debt data to executives?
Executives respond to financial and strategic framing, not technical jargon.
a. Dashboard Components
A good tech debt dashboard should show:
- Technical Debt Ratio (TDR) by product or system
- Annual Productivity Cost (APC) in dollars
- Untapped Capacity (FTEs) — e.g., “We’re losing 12.5 full-time devs’ worth of output”
- Trend Over Time — show whether debt is shrinking or growing
- ROI Forecast — potential savings from remediation
b. Executive Summary Report (Slide Deck)
Structure it around:
- Current State: visualize debt by component or team
- Business Impact: show costs (APC, CoD) in dollar terms
- Priorities: present ranked list (using ROI or value-effort matrix)
- Remediation Plan: expected ROI and timeline
c. KPIs to Track
- Technical Debt Ratio (TDR)
- % of Time on Technical Debt
- Average Deployment Frequency (from DORA)
- Reduction in Mean Time to Restore (MTTR)
- Cost Avoidance (reduced APC or CoD post-remediation)
What’s an acceptable or healthy level of technical debt?
There’s no one-size-fits-all threshold, but benchmarks exist:
| TDR Range | Severity | Healthy Level (by Context) |
|---|---|---|
| 0–5% | Minimal | Ideal for new codebases and regulated industries (e.g., healthcare, fintech) |
| 5–15% | Moderate | Acceptable for mature products with regular releases |
| 15–30% | Significant | Manageable if debt is known, documented, and controlled |
| 30–50% | Severe | Indicates architectural issues; intervention needed |
| >50% | Extreme | Unsustainable — likely cheaper to rebuild |
Industry benchmarks:
- Fintech & Banking: <10%
- SaaS & Startups: 10–20% acceptable
- Enterprise Legacy: 25–35% manageable with mitigation
Rule of thumb:
Technical debt is healthy if it’s intentional, visible, and monitored — not if it surprises you.
Can Pragmatic Coders help me manage technical debt?
Yes! Pragmatic Coders absolutely helps companies manage technical debt. It’s one of the core areas where our teams deliver real, measurable impact.
We do this through a dedicated service called “Legacy Code Rescue”, which focuses on modernizing and stabilizing old systems burdened with technical debt. Our approach combines refactoring, architecture redesign, and infrastructure automation to extend product lifespan and reduce long-term maintenance costs.
How does technical debt affect product delivery timelines?
Technical debt reduces delivery velocity in measurable ways.
a. Slower Lead Time for Changes
DORA metrics like Lead Time and Deployment Frequency drop as engineers spend more time debugging or working around brittle systems.
Example: A team delivering 2 features per sprint improved to 3 after refactoring — a 50% throughput gain.
b. Increased Cycle Time
Debt adds complexity, slowing review, testing, and deployment.
If average cycle time rises from 3 to 5 days, the Cost of Delay (CoD) rises proportionally.
c. Higher Failure Rate and Rework
Each rollback, hotfix, or delay compounds cost — not just hours, but lost revenue.
d. Case Study (Illustrative)
A payments SaaS firm reduced legacy dependencies, cutting deployment time from 8 hours to 2.
→ Launched pricing features 3 weeks earlier.
→ Captured $500K faster revenue (CoD reduction).
Bottom line: Technical debt acts as a drag coefficient on speed and innovation.
How do I calculate the total cost of technical debt across multiple systems or teams?
To scale your calculations, treat each system as a cost unit and aggregate results.
a. Define Units
For each team/system, calculate:
- TDR
- APC (Annual Productivity Cost)
- CoD (Cost of Delay)
- Remediation Cost
b. Roll Up to Portfolio Level
Use a weighted average or sum:
- Total Portfolio TDR = (Σ Remediation Cost) / (Σ Development Cost)
- Total APC = Σ (Team APC)
- Total CoD = Σ (System CoD)
Then calculate:
Portfolio ROI = ((Σ Reduced APC + Σ Reduced CoD) – Σ Remediation Cost) / Σ Remediation Cost
c. Visualization Tip
Create a bubble chart:
- X-axis: TDR
- Y-axis: APC ($)
- Bubble size: system criticality or user base
This helps leadership make capital allocation decisions.